
The Case of the Missing Traders & Shrinking Ranges
Nifty is drifting in a soft downtrend on the lowest volumes in 26 weeks. With daily ranges shrinking below 80 points, patience is key. Wait for a breakout.
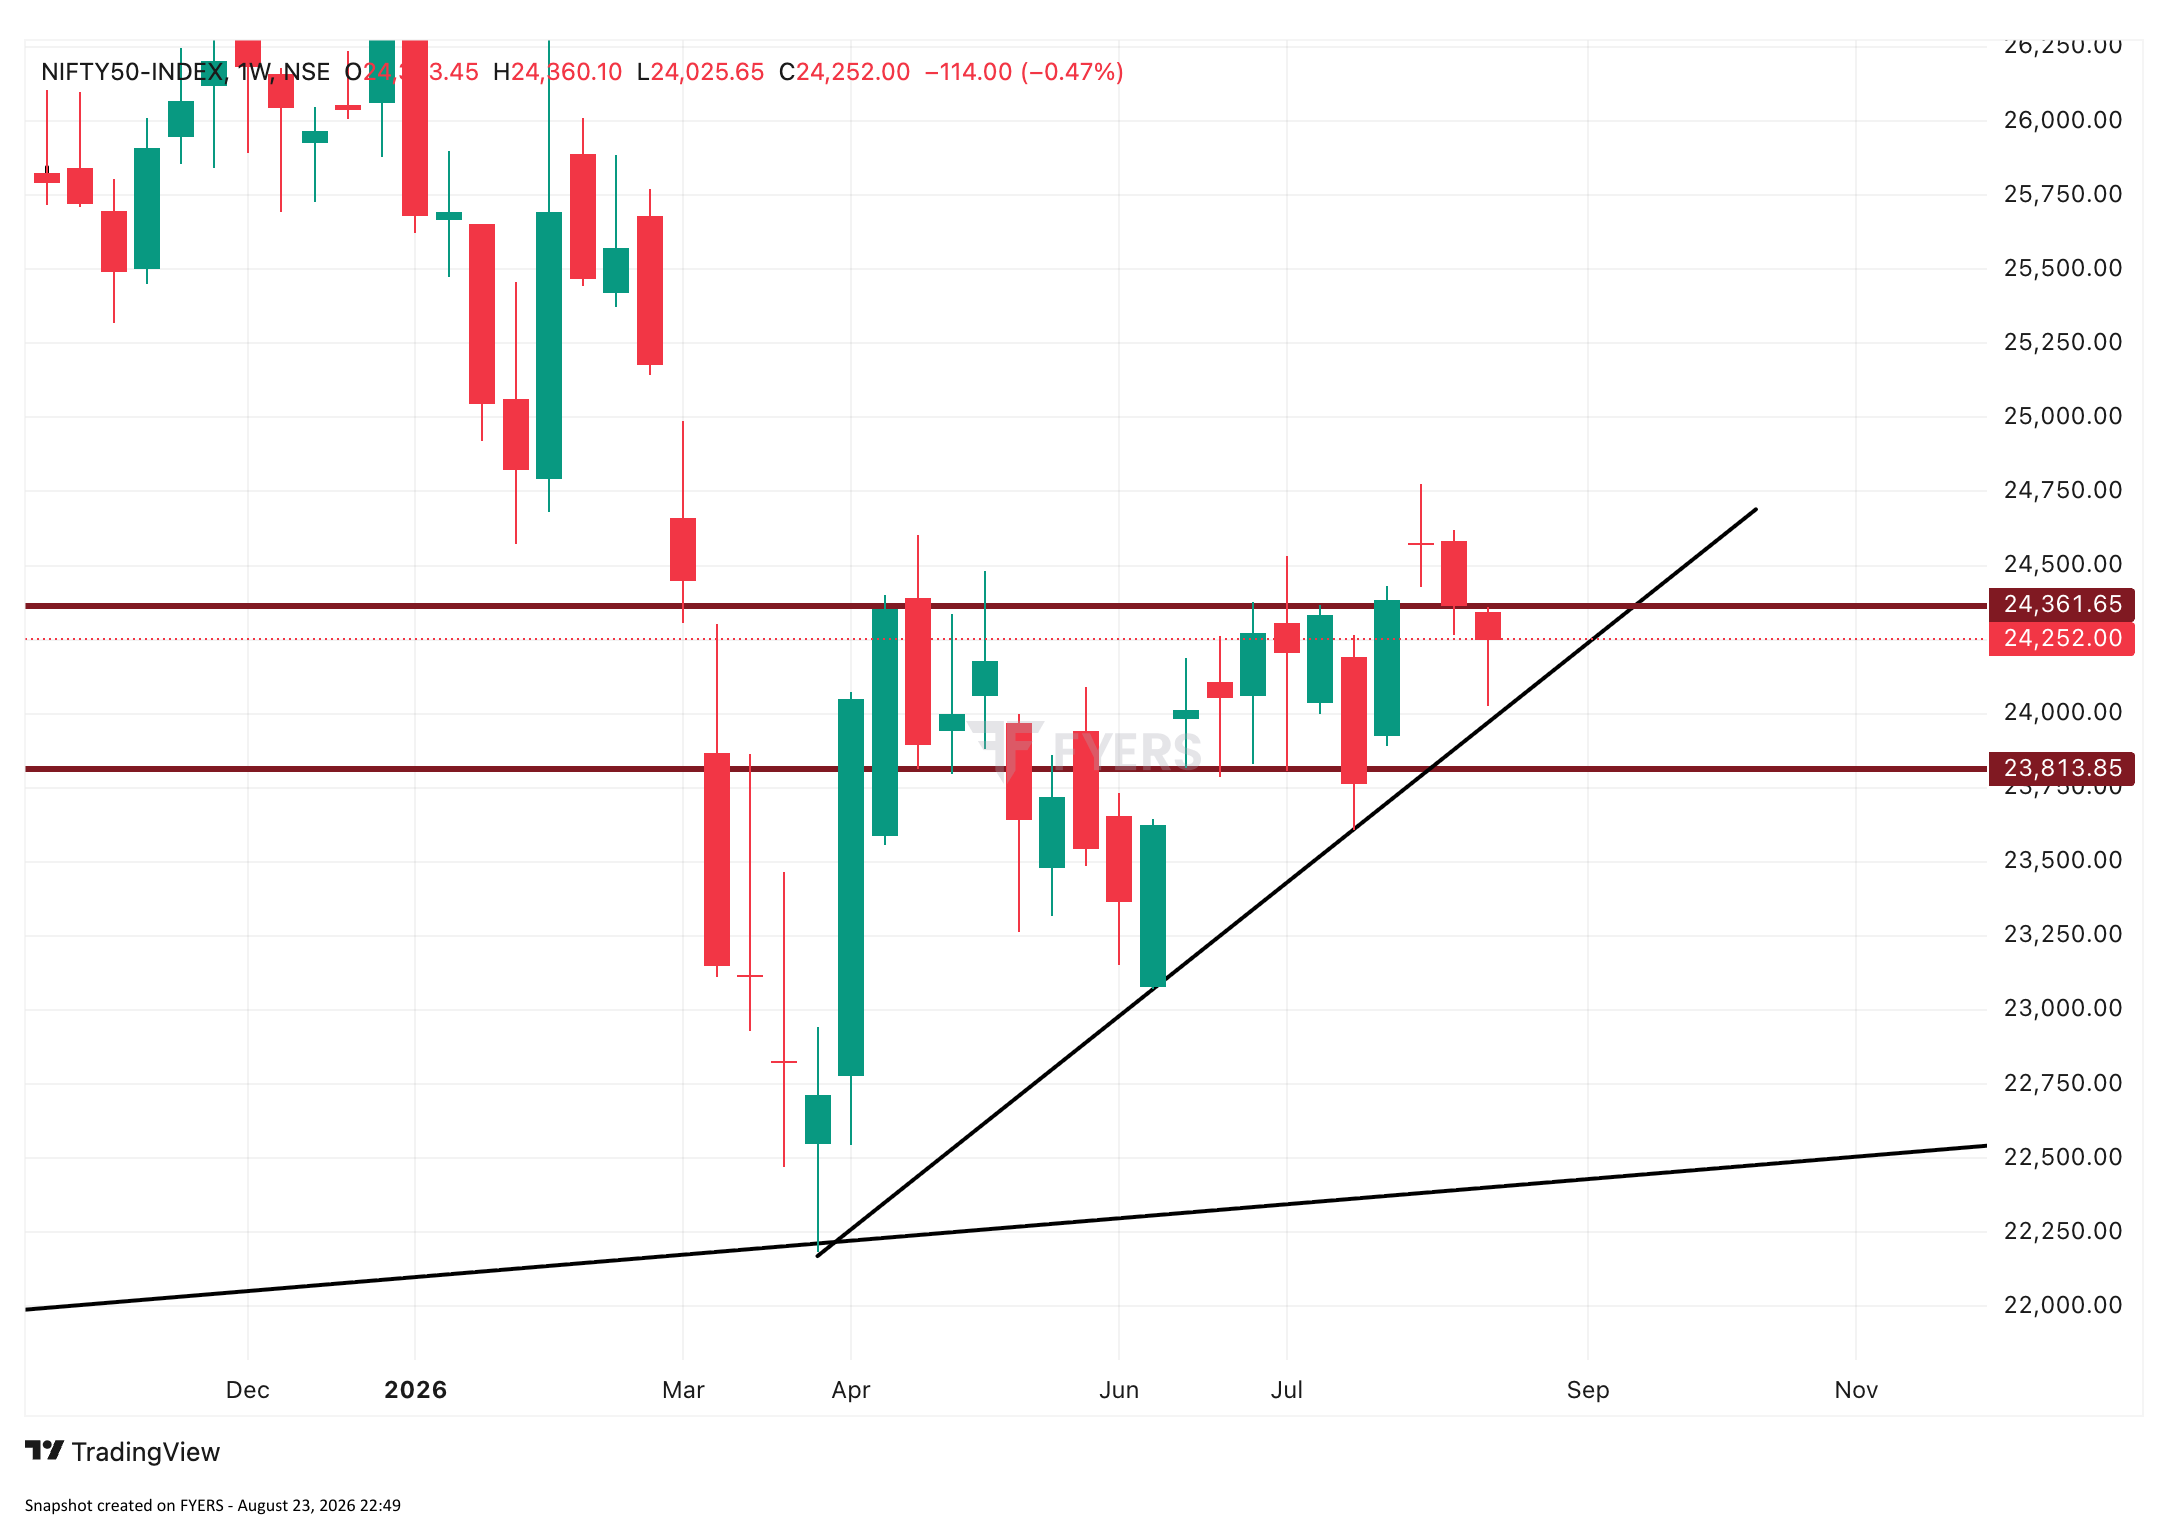
Namaste traders! Let us look at what the charts are telling us this week. If you look at the weekly Nifty chart, we have now seen two consecutive weeks of a lower high, lower low, and lower close. The index closed at 24,252, down just 91 points for the week. The black upward-sloping trendline on the chart is still acting as a floor, but the price is clearly trapped below that thick red resistance line at 24,361. It is a downtrend, but a very gentle one.
But here is the real story that matters more than the price: the trading volume. Over the last four weeks, participation has dropped completely. We went from 1,993 million shares to 1,204 million shares. That is a 40% drop, making last week the lowest volume we have seen in 26 weeks! When a market falls on heavy volume, it means real sellers are dumping shares. But when it drifts down on such light volume, it simply means the buyers went home. The price is sagging just because nobody is there to hold it up.
As a retail trader, you must remember a golden rule: thin markets move very easily. Because there are so few active participants right now, the first big player to show up with real money will cause a very sudden, sharp move. This is a soft, low-energy market right now. It is neither crashing, nor has it found a solid bottom yet.
Now, let us zoom in on the daily chart. From August 4 to August 19, Nifty made a frustrating twelve lower highs in a row. But finally, this pattern stopped. On Thursday and Friday, the market posted two days of higher highs and higher lows. This is a real change in behaviour and a sign that the market is trying to bounce off that rising black trendline.
However, do not celebrate a full reversal just yet. To actually confirm a turn, we need a daily close above the 24,360 mark—that solid red line on the chart. That level is still over 100 points away and has not been tested. Furthermore, Friday gave us a minor warning. It opened at 24,284, which was above a small resistance wall of 24,265, but it could not hold that level and closed below it. It was a weak rejection, but a rejection nonetheless.
The biggest headache for intraday traders right now is the size of the daily moves. On Thursday, the total movement from high to low was just 80 points. On Friday, it was even smaller at 77 points. These are the narrowest back-to-back days we have seen in 30 sessions! Our trading rules say we need a daily range of about 130 points to safely catch a trend. When the market moves less than 100 points all day, it is mostly flat, sideways chop.
I looked closely at Friday's 5-minute intraday charts, and it was quite shocking. The highest price of the day was hit at exactly 09:15 AM on the opening bell. The lowest price was hit at 09:30 AM. That means 100% of Friday's 75-point movement happened in the first 30 minutes! From 09:45 AM all the way to the 3:30 PM close, the price never broke that opening range. Midday was completely dead. If a day settles inside its first 30-minute range, the day is probably over. Just close your screen and save your energy.
Looking at the broader world, this laziness makes sense. US markets fell heavily overnight, with the Dow Jones dropping over 1.3%. Global crude oil prices are holding high above $93 a barrel, which puts pressure on our markets. Foreign Institutional Investors (FIIs) sold about Rs 542 crore in the cash market on Friday. Thankfully, our Domestic Institutional Investors (DIIs) stepped up and bought Rs 2,124 crore, which is why we didn't fall hard. With the big indices sleeping, action has shifted to smaller stocks, which managed to close in the green.
So, what is the gameplan for this week? On Monday, watch the first 30 minutes carefully. If the range is small and price stays inside it, do not force a trade. Tuesday is the monthly expiry. For Wednesday to Friday, we will only take action if the market finally decides to wake up and give us a day with more than 130 points of movement. Until Nifty crosses 24,360, be patient and keep your capital safe.
- Nifty closed at 24,252, down marginally for the week in a very soft, slow downtrend.
- Trading volumes have fallen for 4 straight weeks, hitting a 6-month low. Big players are missing.
- A 12-day streak of lower highs finally broke, showing a small bounce, but no clear reversal yet.
- A daily close above 24,360 is required to officially end this gentle downtrend.
- Intraday ranges are terrible; Thursday and Friday moved less than 80 points total all day.
- On Friday, the entire day's high and low were set in the first 30 minutes of trading.
- Tuesday is the monthly expiry; as per rule, we will not initiate new trades on this day.
Prepared by Nitish Goyal, SEBI Registered Research Analyst (INH000025993), under EquityMuni / Trading Baniya. For educational purposes only and not investment advice. Investment in securities market are subject to market risks; read all related documents carefully.