
Nifty's Squeeze: Failed Breakout or Just a Rest?
Nifty faced a slow week, falling 205 points as sellers dominated the open. However, low volumes and strong weekly support at 24,313 suggest buyers just took a break rather than a trend reversal.
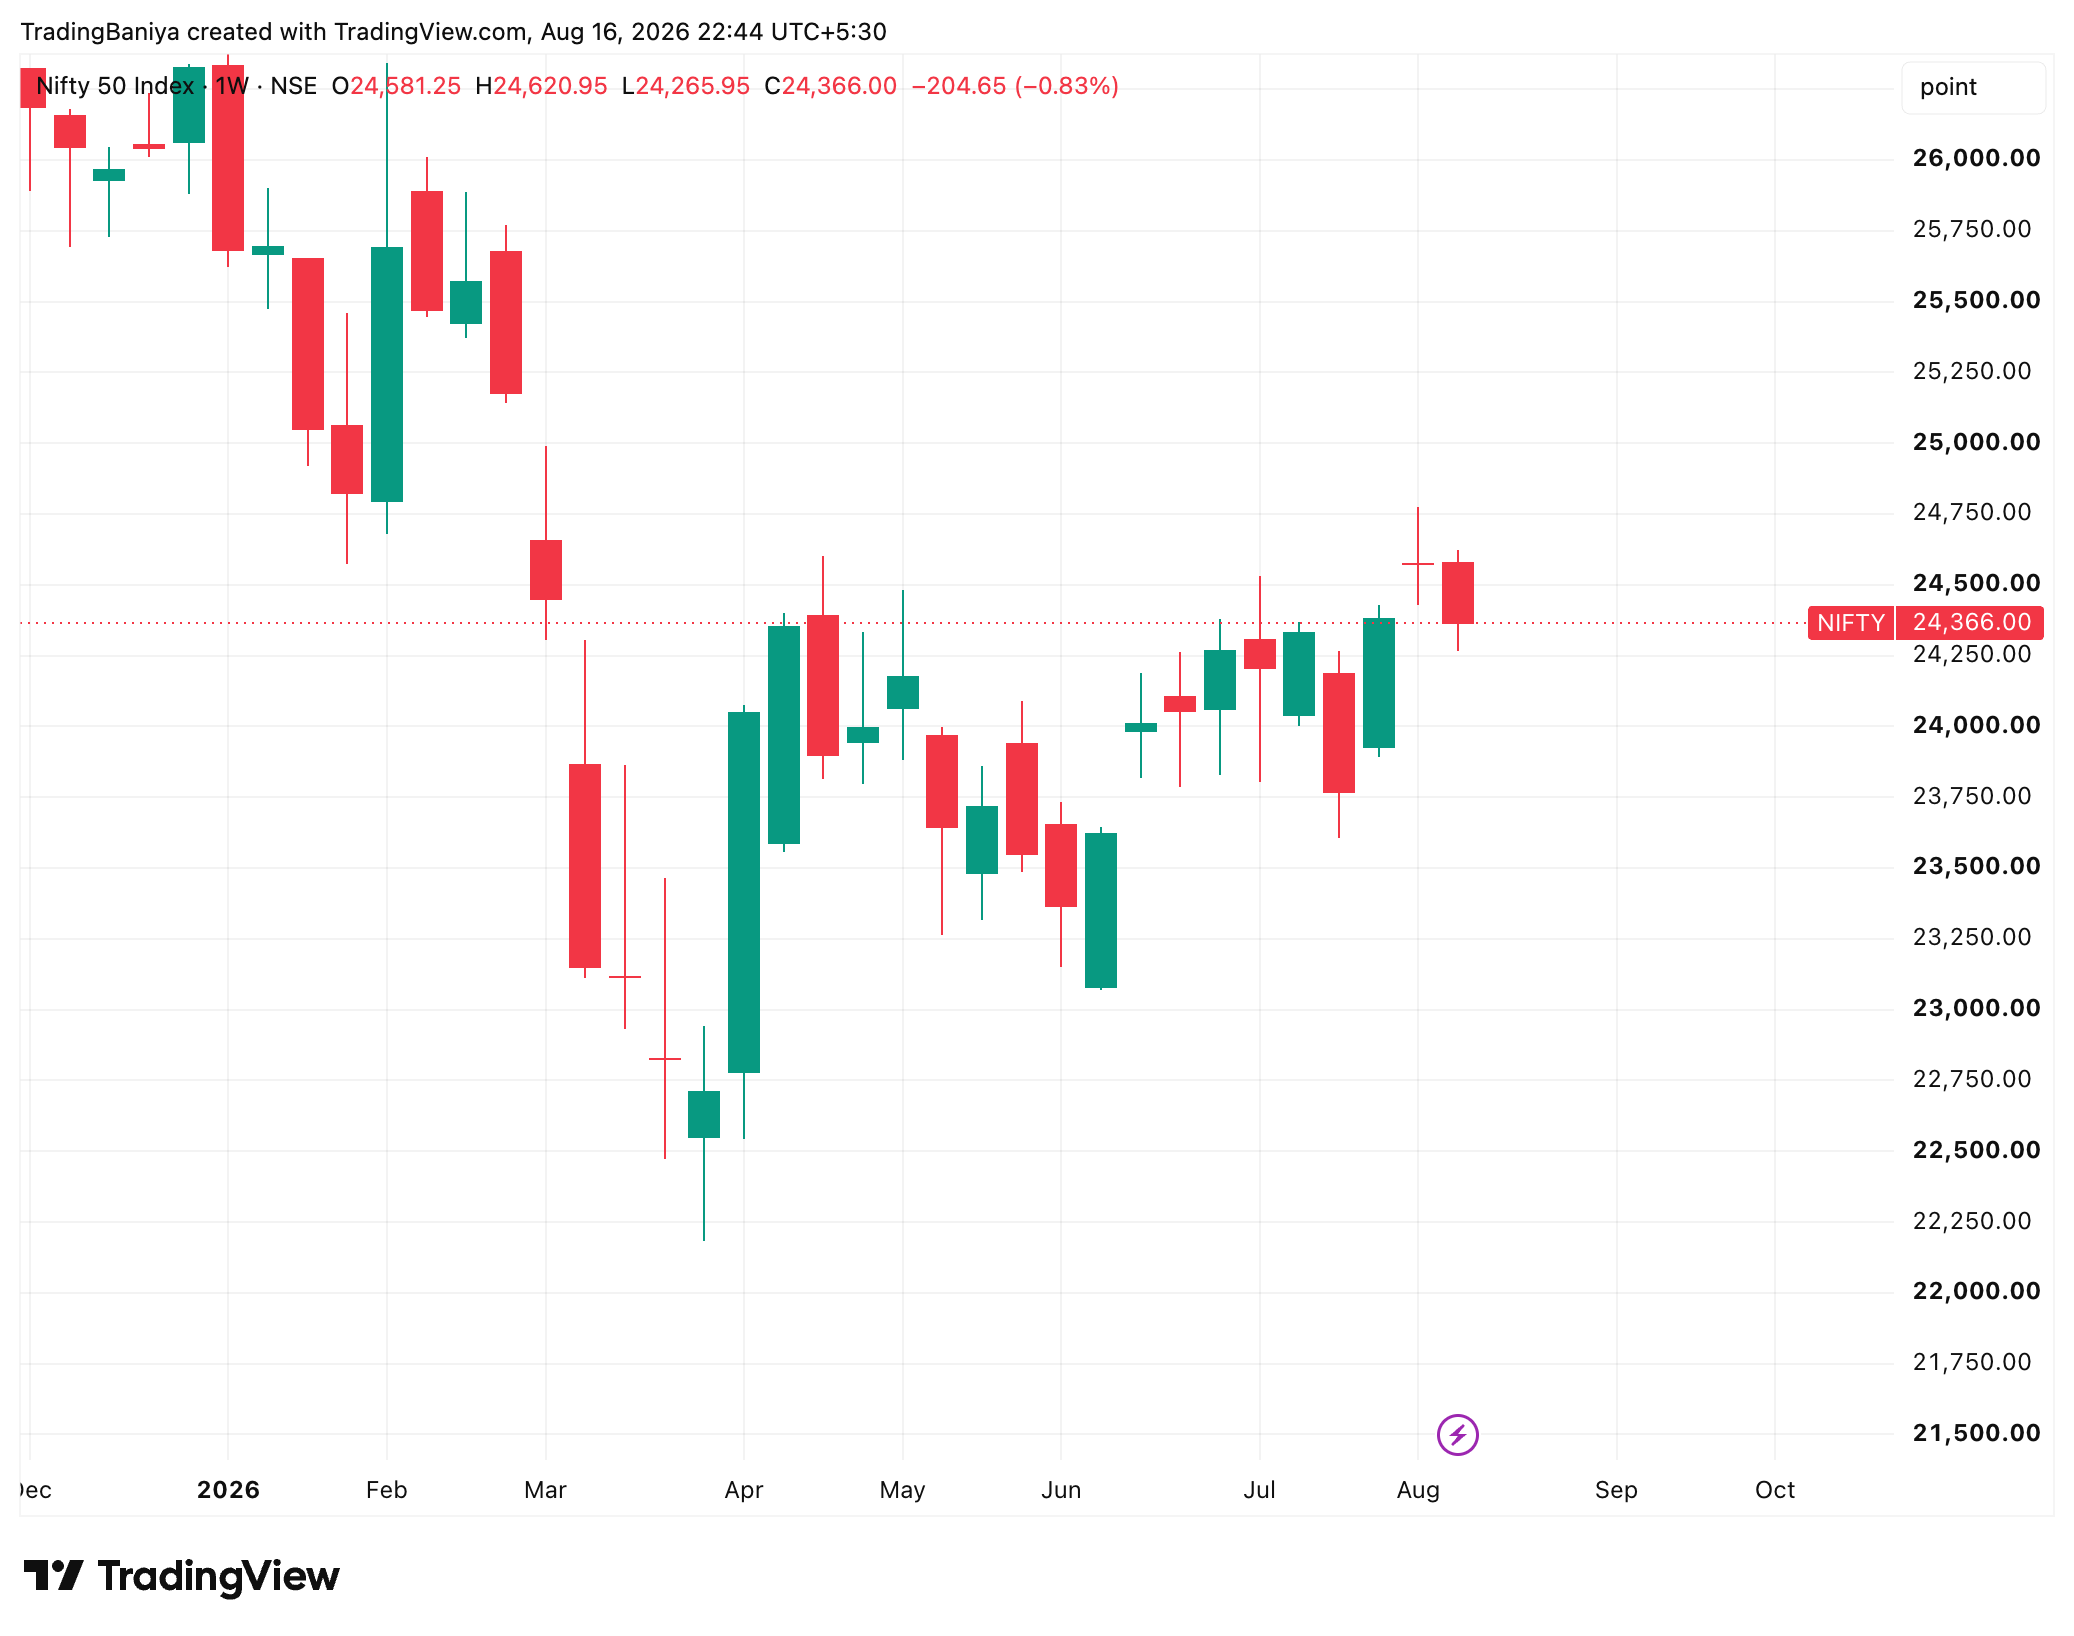
Namaste friends! This week was a bit of a slow bleed for the Nifty. We fell about 205 points to close the week at 24,366. The big six-day battle at the 24,601 level is finally over, and for now, the sellers have won that fight. But as I always say in the market, it is not just about who won, but exactly how they won. Let us look closely at the charts to understand the real story.
The most interesting thing on the daily chart this week was a very rare pattern. For three straight days (Tuesday, Wednesday, and Thursday), the opening price of Nifty was exactly (or almost exactly) the high of the day. Think about what that means in simple words: the moment the market bell rang at 9:15 AM, sellers were sitting there waiting to dump their shares. Buyers did not get a single chance to push the price up before the selling started.
However, Friday finally broke this negative pattern. The market opened at 24,362 and managed to go up 43 points first. For the first time in four days, the buyers actually got to make the first move. The daily candle for Friday ended up looking like a 'Doji' — a candlestick shape that looks like a plus sign with a long shadow at the bottom. This long lower wick shows that when prices fell, buyers quickly stepped in to catch them.
Now, let us talk about the volume (the number of shares traded), because price only tells half the story. Most people see the market falling and immediately think, 'Oh, heavy selling is happening!' But our charts show something completely different. The total trading volume for the entire week was the lowest we have seen in over a month.
On Wednesday, when the market broke down to its lowest point, the volume peaked. But on Thursday and Friday, as the price kept drifting lower, the volume actually fell. This is a massive clue for us. It tells us that the market did not fall because large sellers were aggressively attacking. It fell simply because the buyers decided to step back and wait. When buyers walk away, even a little bit of regular selling can easily push the price down.
So, what are the big institutional players doing? The clues are a bit mixed. On the bearish side, we have seen nine straight days of lower highs, meaning every small bounce is getting sold by big players. But on the bullish side, both Foreign Institutional Investors (FIIs) and Domestic Institutional Investors (DIIs) were actually net buyers in the cash market on Friday, buying ₹508 crore and ₹356 crore respectively.
The biggest positive point for the bulls is sitting right on the weekly chart. There is an important moving average line (the Weekly EMA) at 24,313. All week long, whenever the Nifty fell near this zone (making lows of 24,266, 24,311, and 24,297), it magically bounced back. This 24,313 line is acting like a very strong floor for the market.
Right now, the Nifty is stuck in a vice grip. On the weekly chart, the upper ceiling (the Bollinger Band) is slowly coming down from 24,622 to 24,592. Meanwhile, our floor at 24,313 is coming up. The price is being squeezed into a tight 279-point box. The space is shrinking, and soon, Nifty will have to break out of this box in one clear direction.
Just to add a little colour from the outside world, global markets are a bit nervous right now. There is geopolitical tension in the Middle East, which has pushed crude oil prices up to around $87 a barrel. When oil goes up, it is usually a headache for India. But our markets have mostly ignored this so far, thanks to our own strong domestic support.
So, what is the final conclusion for a regular retail trader? My read is simple: this is just a failed breakout that is unwinding, not a massive market top or a crash. The attempt to cross 24,601 has failed for now. But 'the breakout failed' and 'the trend has reversed' are two very different things. As long as we are above 24,266, this is just a normal pullback in a larger uptrend.
Next week, we have only one major question to answer: Does the 24,313 to 24,266 support zone hold? If it holds, we could see a bounce back towards 24,418 and 24,434. Watch how the price behaves there — if it struggles, it might just be a small relief bounce. If it crosses that hurdle boldly, we are back in the bullish game.
But, if the market breaks below 24,266 and gives a weekly close under 24,313, that is when we should get careful. That would be the first real damage to the multi-week uptrend, opening the doors for a fall towards 24,136. For now, keep your position sizes small, respect your stop losses, and wait for the market to pick a clear direction out of this tight squeeze.
- Nifty fell 205 points this week, showing that the 24,601 breakout attempt has failed.
- For three days straight, the market opening price was the highest point of the day, showing heavy supply at the start.
- However, the total weekly trading volume was the lowest in over a month.
- This low volume means the market fell because buyers stepped away, not because sellers were heavily attacking.
- The weekly moving average at 24,313 is acting as a very strong floor, catching every fall this week.
- The market is currently squeezed in a tight 279-point box, waiting for a clear direction.
- As long as Nifty stays above 24,266, this is just a normal pullback, not a market top.
Prepared by Nitish Goyal, SEBI Registered Research Analyst (INH000025993), under EquityMuni / Trading Baniya. For educational purposes only and not investment advice. Investment in securities market are subject to market risks; read all related documents carefully.