
Nifty's Six-Day Climb Hits a Brick Wall: What's Next?
Nifty has staged a beautiful recovery from recent lows, but Friday's chart showed the first signs of exhaustion. We are now entering a heavy resistance zone where caution is key.
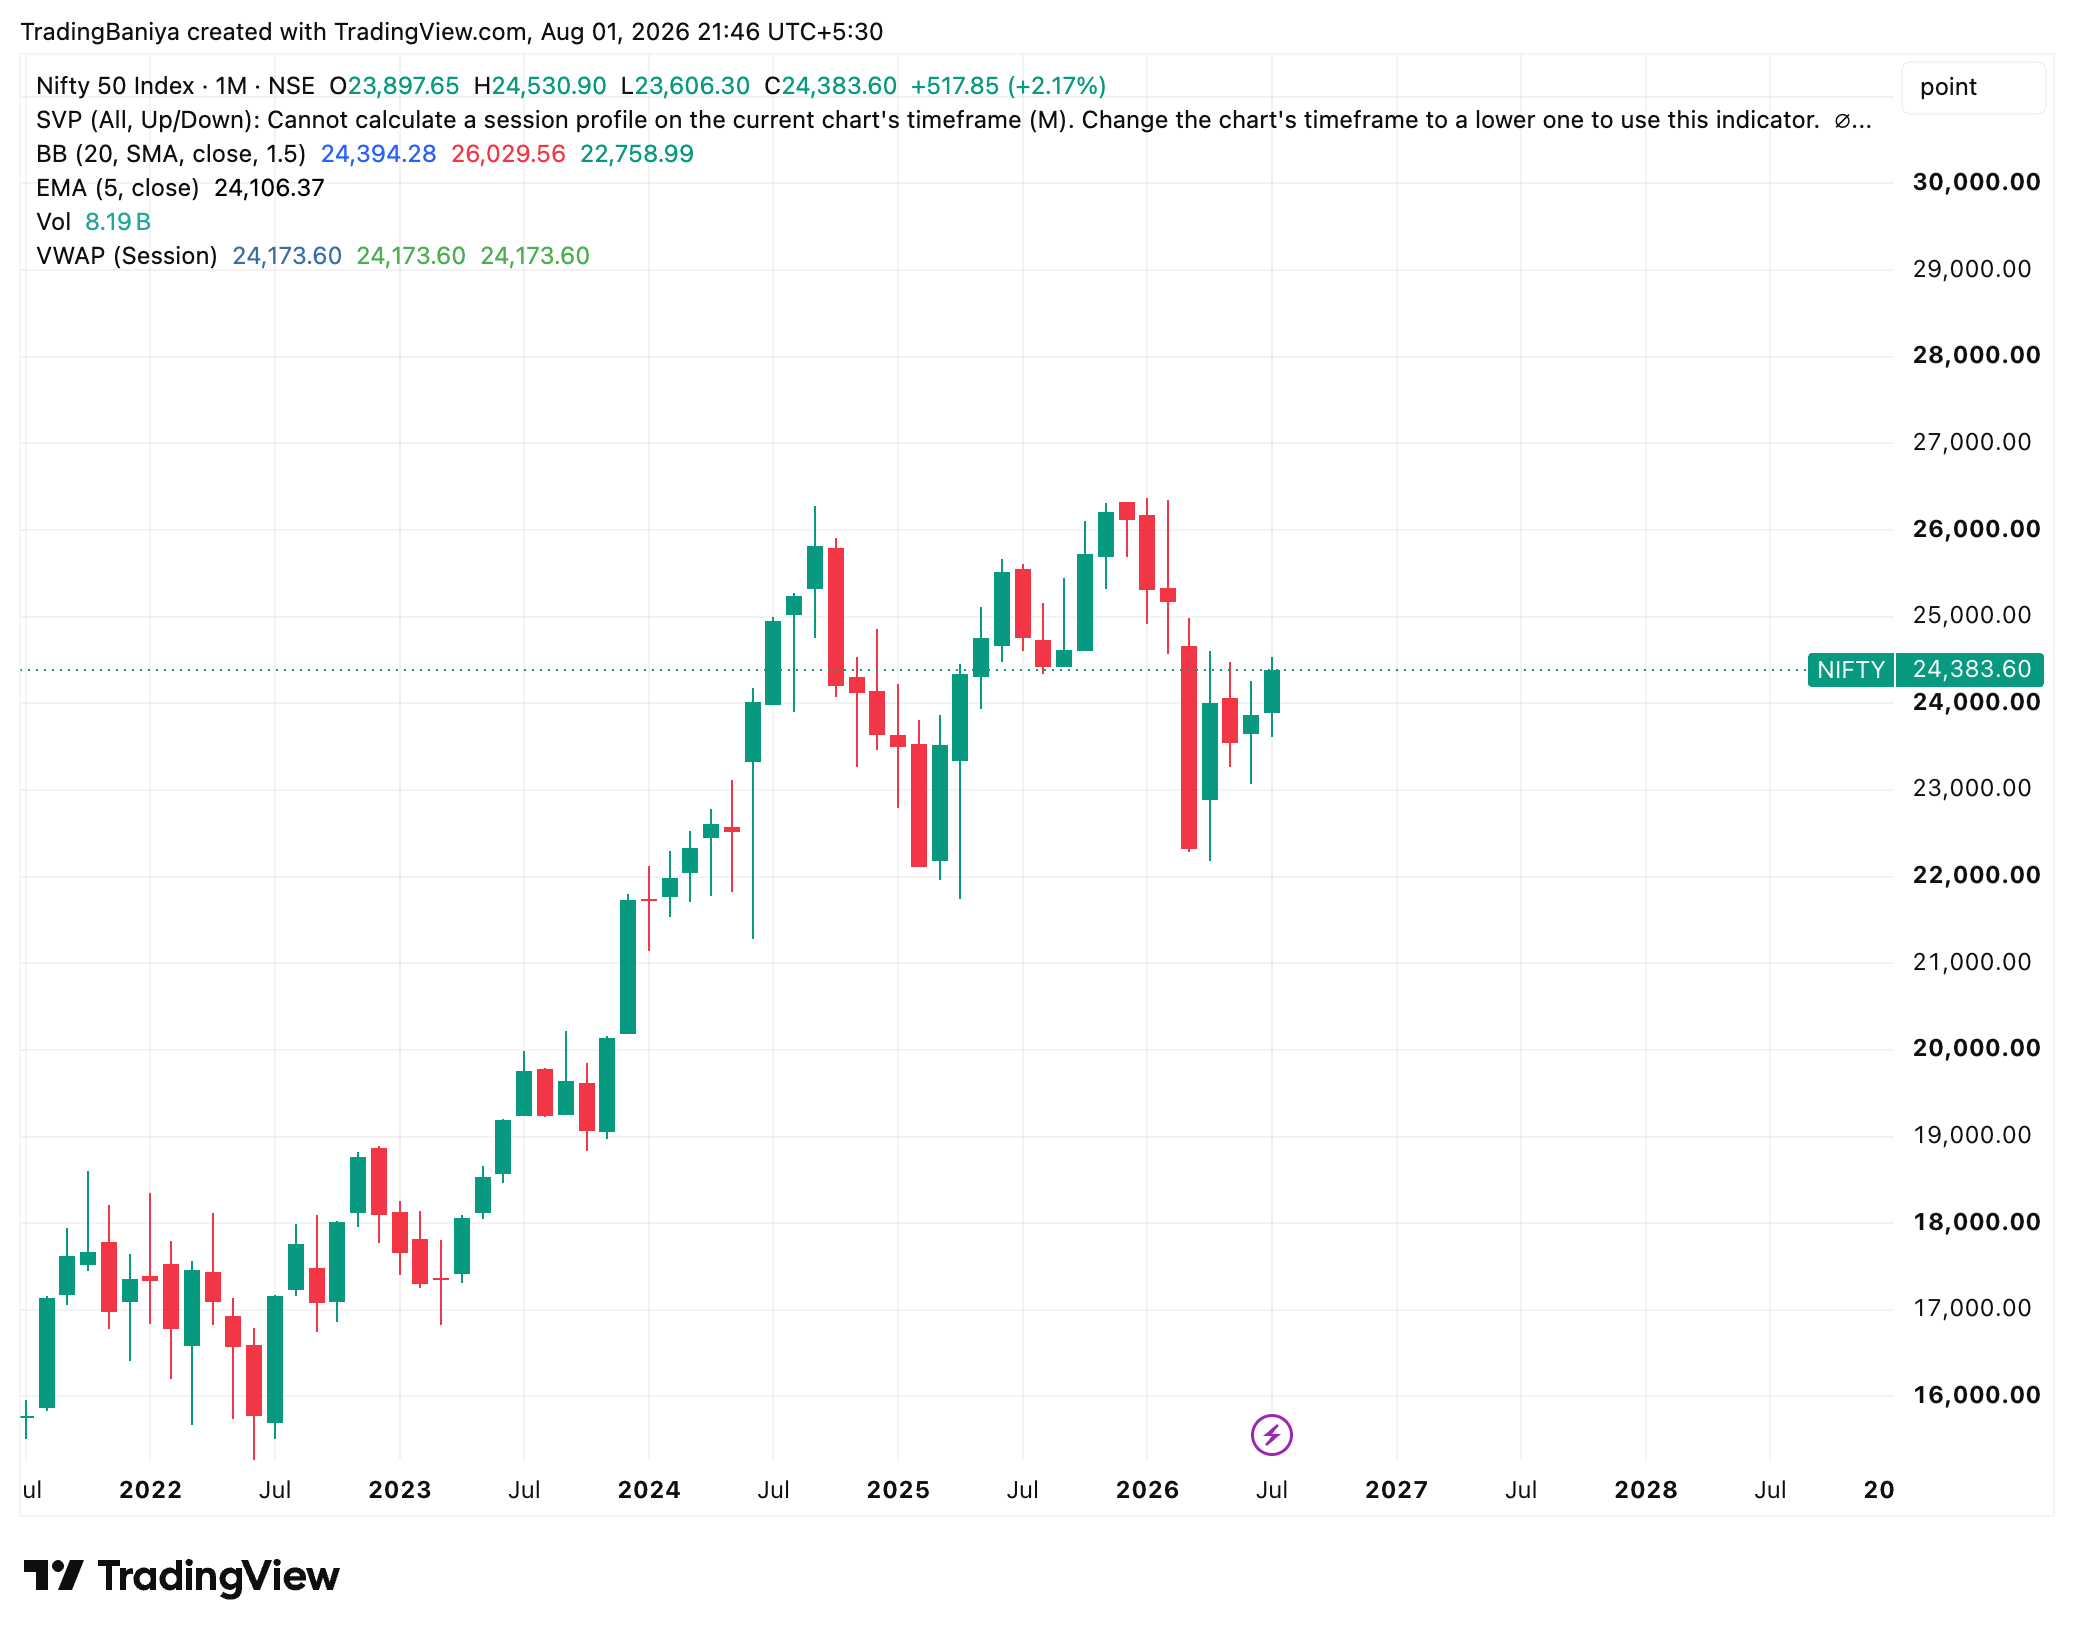
Namaste traders! Let us sit down and look at what the market is trying to tell us. The past week has been a relief for many, with the Nifty climbing steadily for six days straight. However, as we zoom into the charts, we can see that our beloved index is about to knock on a very heavy door. Let us break down the monthly, weekly, and daily views so you can plan your trades like a pro.
First, let us look at the big picture: the Monthly chart. If you zoom out, Nifty has basically been stuck in a large 'box' for about four months. The floor is around 22,150 and the ceiling is near 24,600. July was a very positive month. We saw buyers aggressively defend the 23,606 level, pushing the market up to close green. But here is the catch: Nifty tried to break past 24,530 during the month, but sellers pushed it right back down. So, while the broader tone is bullish, we have unfinished business at the top.
Moving closer to the Medium view: the Weekly chart. The week that just passed was a beautiful, clean bullish week. Nifty opened, went straight up, and closed near its highs, gaining about 2.6%. In technical terms, it completely 'swallowed' the red candle from the previous week. This tells us clearly that buyers have taken back control from that 23,606 bottom. The trend is definitely pointing up, but it is marching straight towards that tough 24,530 to 24,600 supply zone.
Now, let us look at the Daily chart and specifically Friday's action, because this is where the plot thickens. Nifty has built a healthy-looking staircase over the last six sessions—making higher highs and higher lows. But Friday flashed our first real warning sign. The market gapped up in the morning, right into the resistance area of 24,367. It spent hours trying to build energy, finally broke out around noon to hit 24,429, and then completely ran out of gas.
What happened next is crucial. Nifty drifted all the way back down to close exactly where it opened, leaving a small green body with a very long 'wick' or shadow on top. In simple words, this is a classic rejection. Buyers tried their best to push higher, but sellers were waiting at the roof and slapped the price back down. Adding to this, our internal gauges showed that the buying pressure was actually negative; the climb happened more because sellers were temporarily absent, not because buyers were aggressive.
When we put all three charts together, a clear story emerges. The trend is up across the board, but the fuel tank is looking a bit empty just as we are approaching a steep hill. Nifty is bumping into the immediate hurdle at 24,430, and right above that is the massive 'brick wall' between 24,530 and 24,600. Friday was the first sign that this wall is going to be tough to break without fresh, heavy buying.
Looking at the live market context, we can see exactly who is holding the market up. Domestic Institutional Investors (DIIs) were the heroes on Friday, pumping in over Rs 2,260 crore, while Foreign Institutional Investors (FIIs) bought a tiny Rs 277 crore. Sector-wise, financial stocks did the heavy lifting, with Bajaj Finance surging over 8% on great earnings. On the flip side, IT heavyweights like TCS and Infosys pulled the index down due to global worries about profit margins. This tug-of-war between strong financials and weak IT is exactly why the index stalled.
So, what does this mean for a regular retail trader like you and me? It means this is not the time to be a hero or to buy blindly just because the market has been green for a week. The reward-to-risk ratio right here is not in our favour. We are standing right under a heavy ceiling. Buying now is like trying to board a moving train right before it enters a narrow tunnel.
Here is the 'If-This-Then-That' plan for the upside. For the Nifty to truly become a runaway bull, it needs to do more than just peek above 24,600. We need to see a decisive, strong daily close above the 24,600 wall, backed by high volumes and aggressive buying data. Until that happens, any small jump towards 24,500 might just be an opportunity for big players to book their profits.
And for the downside scenario: Keep your eyes glued to the 24,300 level. This is our immediate line in the sand. If Nifty can hold above 24,300, the buyers will likely rest and try to break the 24,530 roof again. But, if sellers push us below 24,300, the door opens for a pullback. We could easily see the index slide down to 24,165, and if that breaks, the major base at 24,040 will be tested. Trade light, keep your stop-losses strict, and let the market show its hand first!
- The broader trend remains UP, recovering strongly from the 23,606 lows.
- Nifty is currently trapped in a 4-month sideways box between 22,150 and 24,600.
- Friday formed a rejection candle (long upper wick) exactly at the 24,430 resistance.
- Internal buying pressure was weak on Friday, showing 'thin fuel' for the rally.
- DIIs are driving the market with strong cash buying, while IT stocks act as a drag.
- A decisive close above 24,600 is required for fresh, safe upside momentum.
- Watch 24,300 closely; breaking below this support could trigger a pullback to 24,165.
Prepared by Nitish Goyal, SEBI Registered Research Analyst (INH000025993), under EquityMuni / Trading Baniya. For educational purposes only and not investment advice. Investment in securities market are subject to market risks; read all related documents carefully.