
Nifty's Crucial Test: A Real Breakdown or a Bear Trap?
Nifty has broken its three-month winning streak by slipping below August's low, but the selling pressure seems to be pausing. Is it a real fall or a trap? Let's decode.
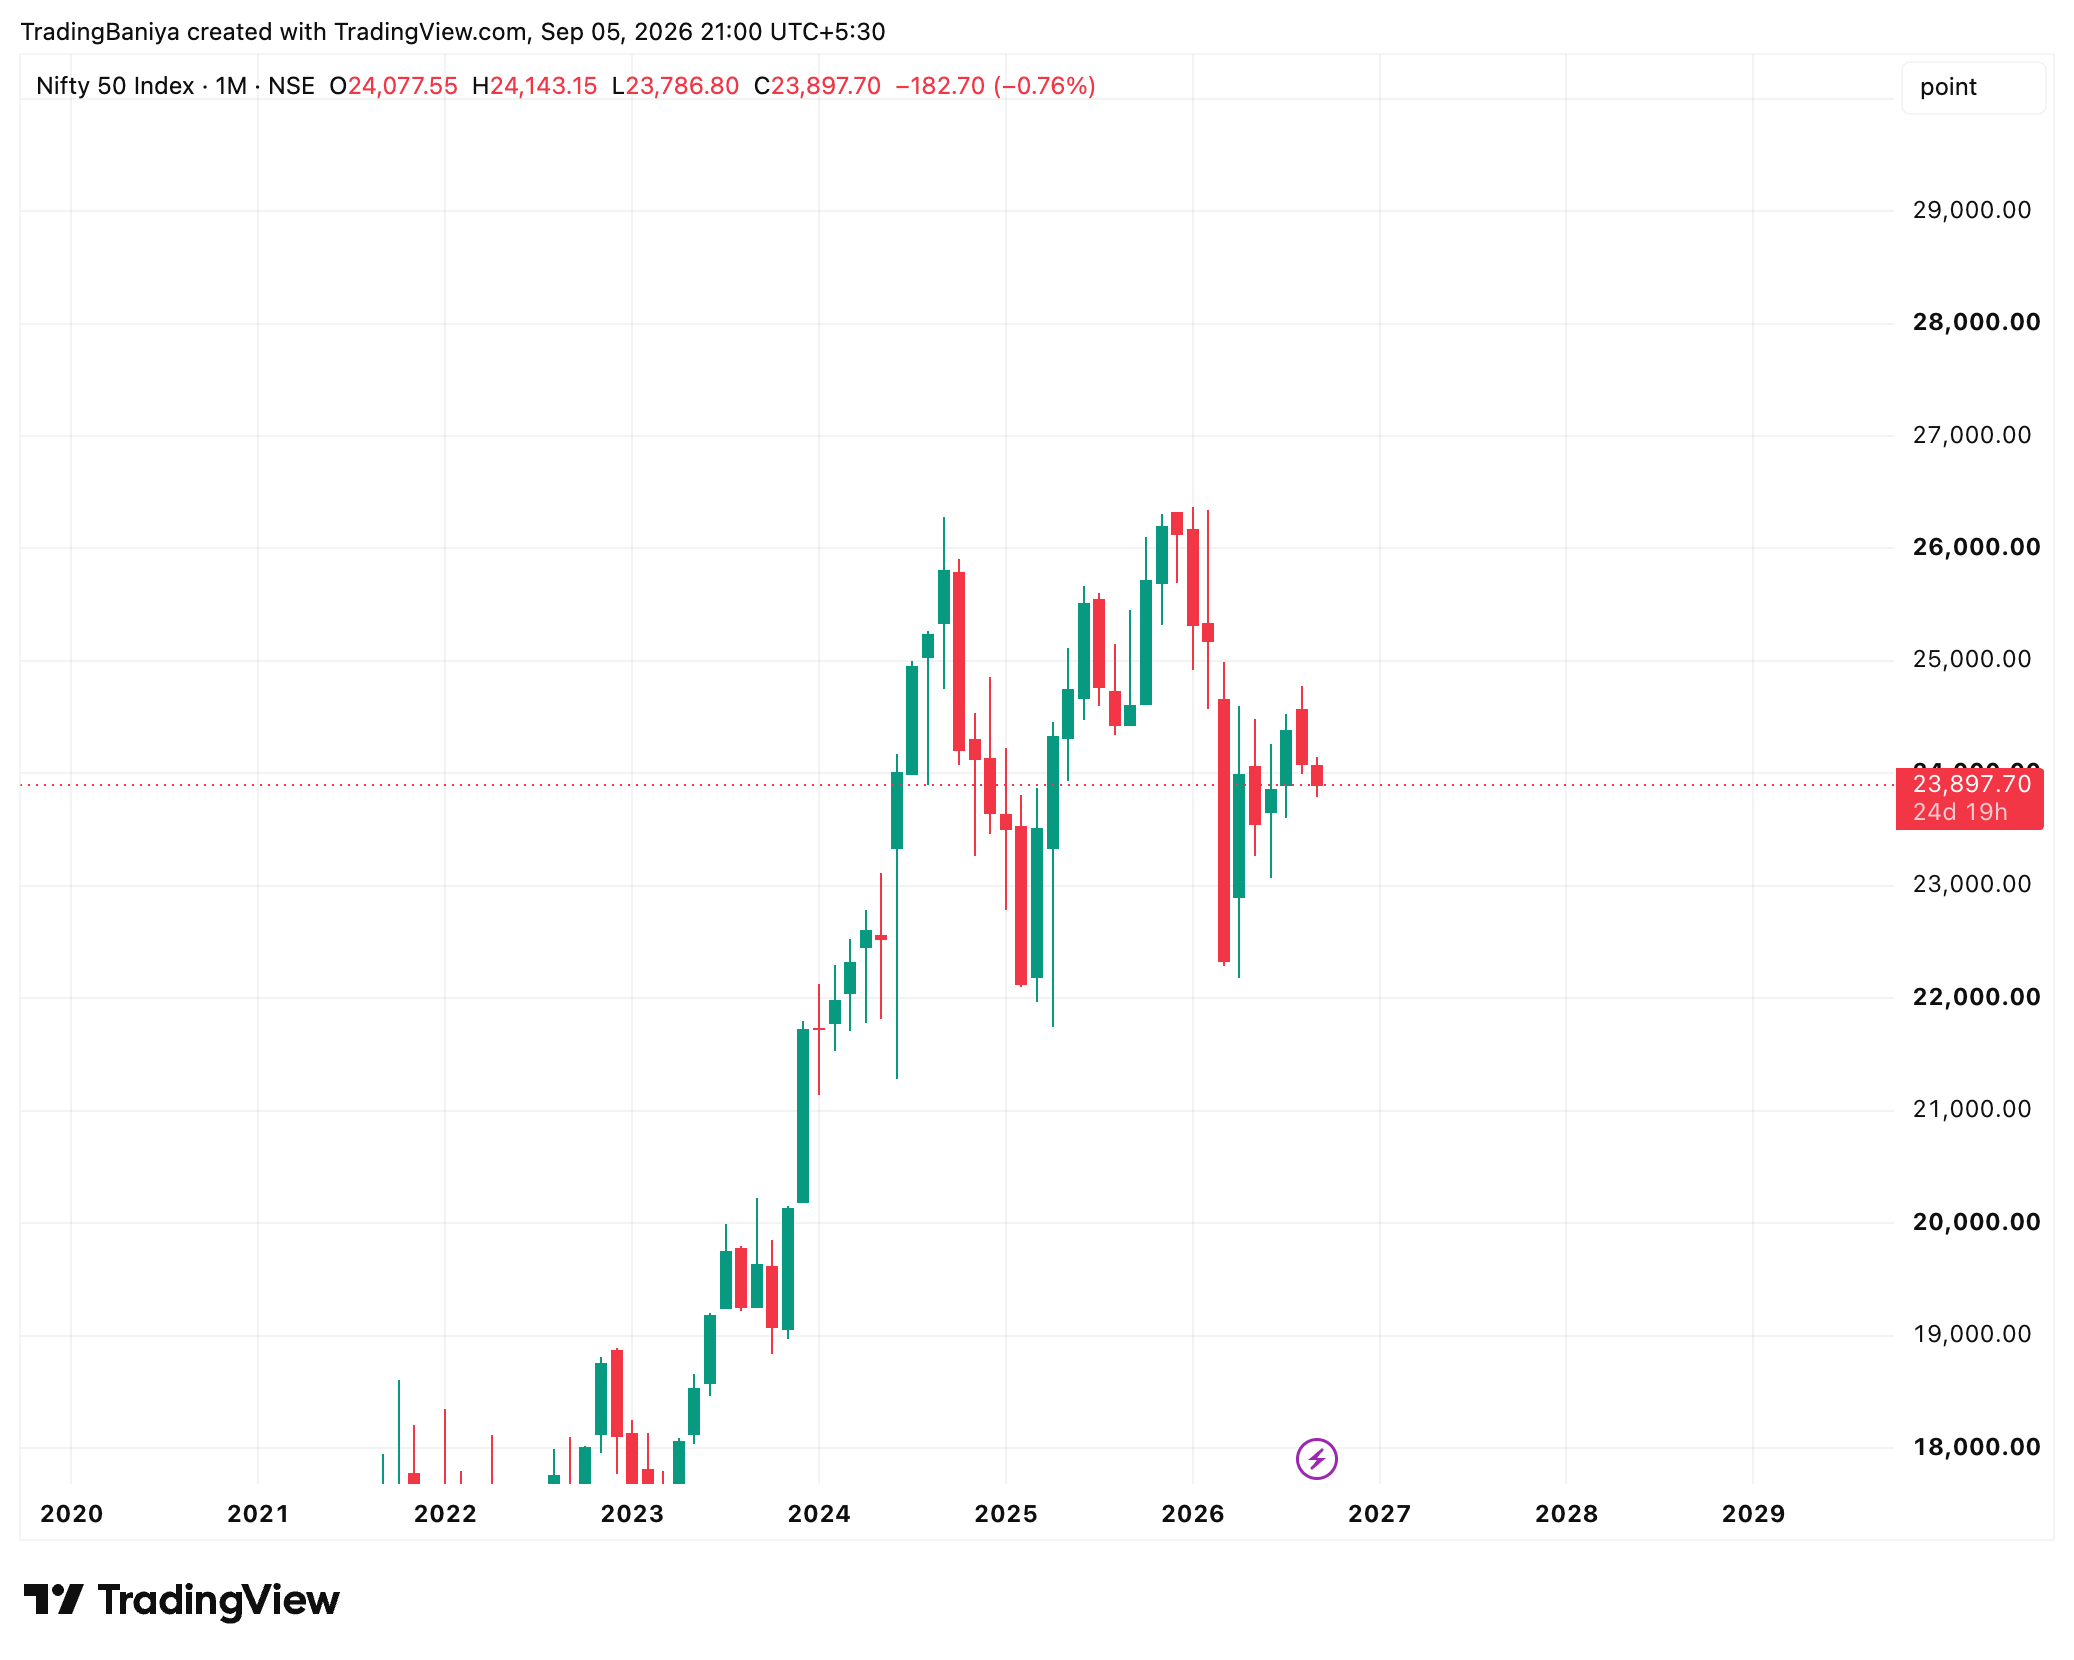
Namaste traders! Let's zoom out and look at the big monthly picture first. For the last three months (June, July, and August), Nifty was making a beautiful 'higher low' pattern, meaning every month's lowest point was higher than the previous one. But September has spoiled the party. August's lowest point was 23,993.60, and September has already slipped below it, touching 23,786.80. This breaks the main argument for the bulls. However, remember we still have about 17 trading sessions left in the month to see if this breakdown is real or just a fakeout.
Moving to the weekly charts, we just saw our fifth straight lower weekly close. For the past month, I noticed that the weekly falls were getting smaller and smaller—like a spring getting tightly coiled. Well, that spring just snapped downwards. This week's 356-point fall was 3.6 times bigger than the previous week, and trading volume shot up by 37%. A larger fall on higher volume tells us that the bears briefly took total control of the steering wheel.
But here is where the story gets really interesting on the daily charts. All that weekly damage actually happened on just ONE single day! On September 2nd, the market gapped down heavily. Since then? The sellers completely went to sleep. Over the next three days, trading volume kept falling, and Nifty just coiled inside a tight 218-point box. Friday's trading range was the narrowest of the entire week. The bears punched hard once, but they just didn't follow through.
One strange thing happening right now is at the daily closing bell. For five out of the last nine sessions, the market closed EXACTLY at the highest or lowest point of the day because of post-market auction adjustments (when the exchange calculates the final average close). For example, on Friday, real trading stopped at 23,938.40, but the official close was dragged down by 40 points to 23,897.70. This means half the daily highs and lows you see on the chart are just artificial numbers where no real big trading happened.
Looking at Friday's intraday action, it was a perfectly balanced, quiet day. We opened softly, saw a nice rally up to 11:35 AM hitting 24,005, and then prices slowly faded away all afternoon. Interestingly, the heaviest trading volume came in the final 15 minutes of the day. Our data shows this wasn't panic selling; it was just a quiet shifting of positions before the weekend.
So, how do all these notes come together? My reading is that the downside case is getting slightly weaker, not stronger. Yes, the monthly support broke and the weekly chart looks heavy. But the fact that sellers couldn't push the market down further after that one big gap-down day shows a lack of confidence. A one-day break followed by three days of shrinking volume is exactly the shape a 'failed breakdown' makes in its first week.
Looking outside our borders for some clues, the global mood is quite mixed. US markets saw the Dow Jones rise by over 1%, while tech stocks pulled the S&P 500 down slightly. We also saw Brent crude oil advance past $97 a barrel, which is always something we Indians need to watch carefully as it impacts our inflation. Meanwhile, back home on Friday, Foreign Institutional Investors (FIIs) sold Rs 3,111 crore in the cash market, but our Domestic Institutional Investors (DIIs) came to the rescue, strongly buying Rs 8,930 crore to absorb the selling pressure.
For a regular retail trader, what does this all mean? This is a time for patience, not aggressive betting. The market is currently sitting in a 'no man's land'. We had a breakdown, but the lack of follow-up selling makes it highly suspicious. Your best move is to wait for the market to clearly choose a direction before deploying heavy capital.
Let's keep our trading plan crystal clear for the coming week. If Nifty breaks and sustains below the recent low of 23,786.80, the bears will take full control. Below that line, there is an 'air-pocket' of around 180 points with no major support, meaning prices could swiftly fall to the 23,600 to 23,640 zone.
On the flip side, if the bulls can manage to push Nifty back above the 24,005 to 24,025 zone and hold it there, the September 2nd fall will be officially marked as a trap (a failed breakdown). That would flip the old August support (23,993) back into our favour and open the doors to test 24,143. Until Nifty breaks out of this range, expect it to stay stuck in this choppy 218-point box. Trade light and protect your capital!
- Nifty broke its 3-month winning streak by slipping below August's low of 23,993.
- The weekly chart shows a bearish breakdown with a large 356-point fall on high volume.
- However, almost all the selling happened on one single day (Sept 2), with volumes shrinking ever since.
- Daily closing prices are currently being skewed by artificial post-market auction adjustments.
- FIIs sold Rs 3,111 crore on Friday, but DIIs countered heavily by buying Rs 8,930 crore.
- Bearish scenario: Sustained trading below 23,786 opens a quick drop to 23,600.
- Bullish scenario: Reclaiming and holding above 24,025 proves the recent fall was a trap.
Prepared by Nitish Goyal, SEBI Registered Research Analyst (INH000025993), under EquityMuni / Trading Baniya. For educational purposes only and not investment advice. Investment in securities market are subject to market risks; read all related documents carefully.