
Nifty's Big Test: Will the 24,600 Wall Finally Break?
Nifty has spent three months building a solid base with consistent higher lows. We are now knocking on the massive 24,600 resistance ceiling—a weekly close above this is needed for a fresh rally.
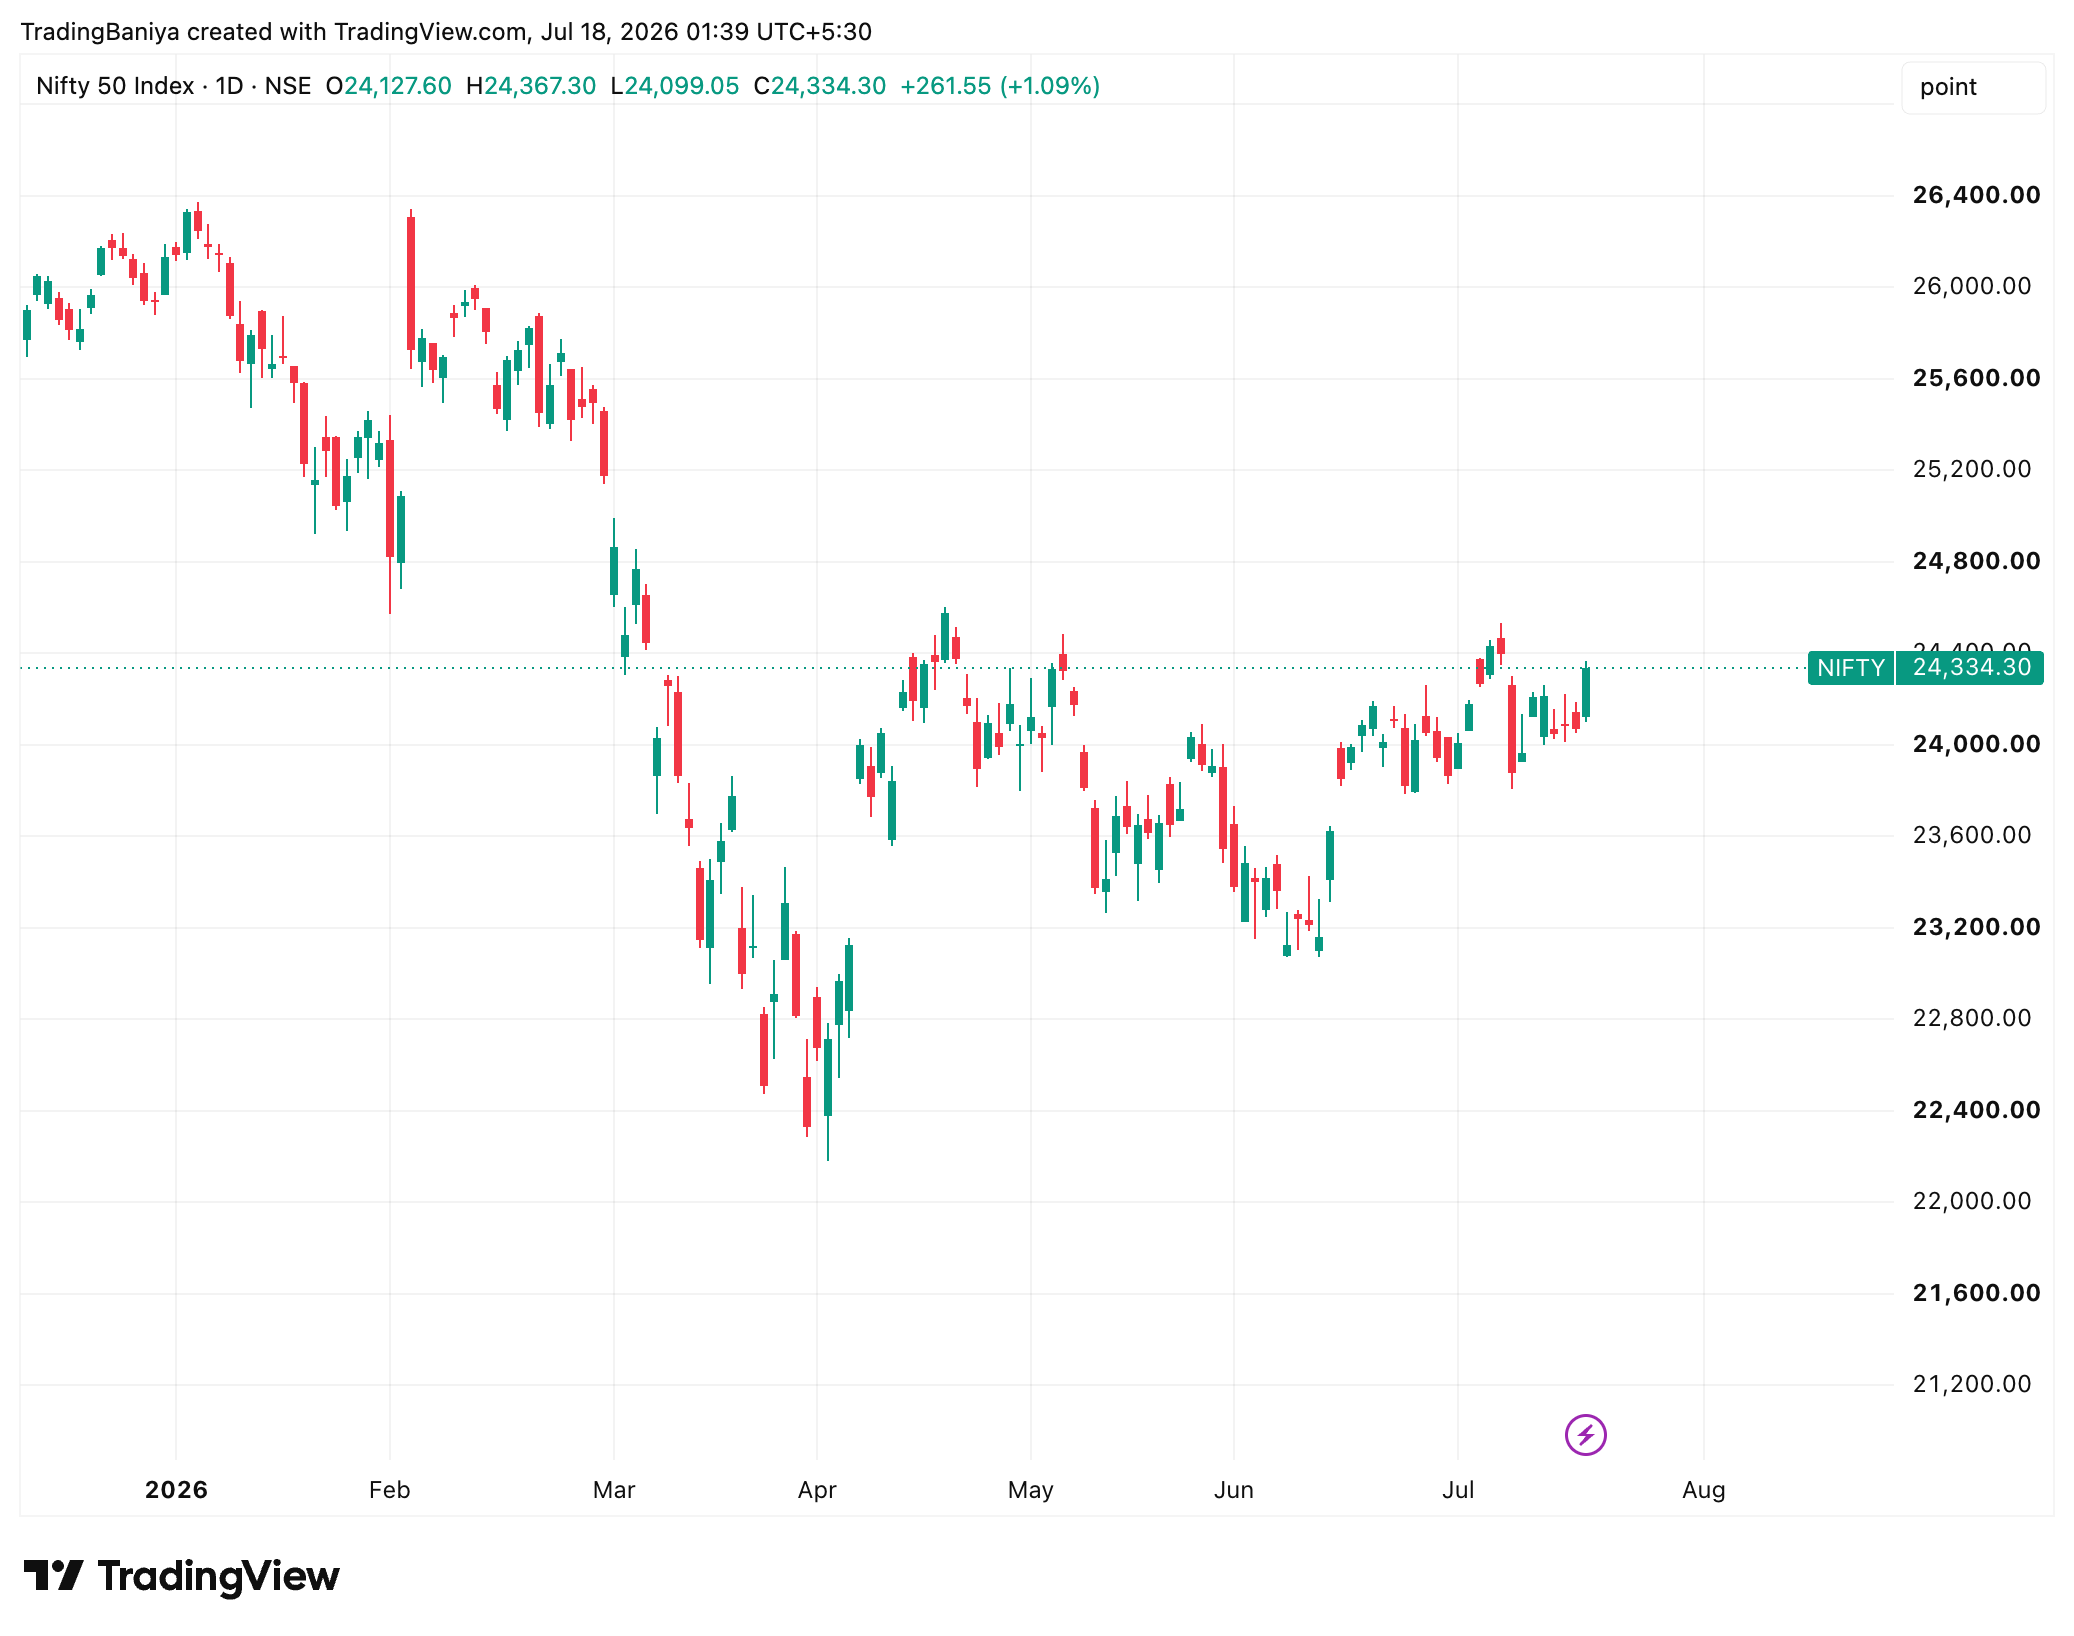
Let us start by looking at the big picture on the weekly chart. Do you remember the major top we hit at 26,373 back in early January? That was followed by a very sharp, painful 16% drop that dragged us all the way down to 22,182 by late February and March. That downward leg was brutal and is still the dominant move you see when you zoom out on the charts.
However, the market has spent the last three months quietly doing the hard work of rebuilding. Since that 22,182 low, we have been stuck in a broad range roughly between 23,070 at the bottom and 24,600 at the top. The most beautiful thing to see on the weekly chart right now is the sequence of 'higher lows'. The market keeps dipping, but buyers step in earlier every time—first at 22,182, then around 23,070, then 23,805, and this week around 24,000. This is a classic sign of smart money accumulating shares.
Technically, the weekly picture is starting to look quite strong. Nifty closed today at 24,334, which is comfortably above the rising 20-week exponential moving average of 24,153. This tells us that the medium-term trend has officially turned positive. We are currently sitting in the upper third of our recovery box, pushing hard against the ceiling.
Now, if we shift our focus to the daily chart, things look even more exciting for the short-term trader. We saw a solid green candle today that pushed price out of the recent 23,805–24,260 chop zone. Nifty closed up over 1%, and Bank Nifty was the real hero, surging by over 900 points. The daily momentum looks fantastic and makes you want to hit the buy button.
But here is where we need to connect the two charts and think like a seasoned Baniya. Today's daily breakout is, in reality, just a fast sprint to test the top of the weekly range. Both the daily and the weekly charts are pointing at the exact same brick wall: the 24,530 to 24,600 zone. Until we cross that wall on a weekly closing basis, we are technically still trapped inside a range.
Let us add some flavour from today's live market action. If you look at the global news, things are actually quite scary. Middle East tensions involving the U.S. and Iran are escalating. This fear caused a massive 13% spike in Brent crude oil prices today because of worries over the Strait of Hormuz. In response, global markets fell, Asian markets like Japan bled over 2%, and our Indian Rupee dropped sharply to 96.28 against the Dollar.
So why did the Indian stock market rally nearly 260 points today despite the global bloodbath? The answer lies in our domestic strength. We are seeing fantastic Q1 earnings momentum, especially from IT giants like TCS and Tech Mahindra, which pushed the IT sector up by 1.75%. Plus, our Domestic Institutional Investors (DIIs) continue to support the market, buying over Rs 1,017 crores today while Foreign Investors (FIIs) sold a mild Rs 376 crores.
What does all this mean for a regular retail trader? It means you should be optimistic, but not reckless. The market structure is highly constructive, and we have strong local earnings shielding us from global panic. However, because we are right near the top of a multi-month range, this is not the place to blindly chase massive breakout trades without confirmation.
Here is the exact 'if-this-then-that' scenario to watch next week. Scenario A: If we get a strong weekly close above 24,600, that is our ultimate green light. It confirms that the recovery base has finally evolved into a brand new uptrend. A break above 24,600 opens the highway straight toward the psychological 25,000 mark, and eventually the 25,470 supply zone.
Scenario B: What if the market gets rejected at the 24,530–24,600 ceiling? Do not panic. It simply means the sideways range continues for a few more weeks. If that happens, expect pullbacks. Your job as a smart trader is to wait for price to dip toward the 24,000 or 23,805 levels and look for buying opportunities there, confident in the knowledge that our ultimate floor at 23,070 is keeping the broader structure safe.
- Nifty has spent the last three months building a solid base after the early 2026 crash.
- The weekly chart shows a beautiful pattern of higher lows, meaning buyers are quietly accumulating.
- Indian markets rallied over 1% today despite heavy global weakness and soaring crude oil prices.
- Strong Q1 IT earnings and massive Bank Nifty buying are acting as a shield against global noise.
- Today's daily breakout is just a push to test the major weekly resistance wall at 24,600.
- A weekly close above 24,600 is mandatory to confirm a fresh mega uptrend towards 25,000.
- If we face rejection near 24,600, the market stays range-bound—use dips to 24,000 to buy safely.
Prepared by Nitish Goyal, SEBI Registered Research Analyst (INH000025993), under EquityMuni / Trading Baniya. For educational purposes only and not investment advice. Investment in securities market are subject to market risks; read all related documents carefully.