
Nifty's 9-Week Slide: A Grinding Fall with a Friday Twist
Nifty has marked its longest losing streak in 2.5 years with 9 consecutive red weeks. While a brutal Thursday gap down hurt bulls, a sharp Friday afternoon bounce saved key levels. The trend remains down.
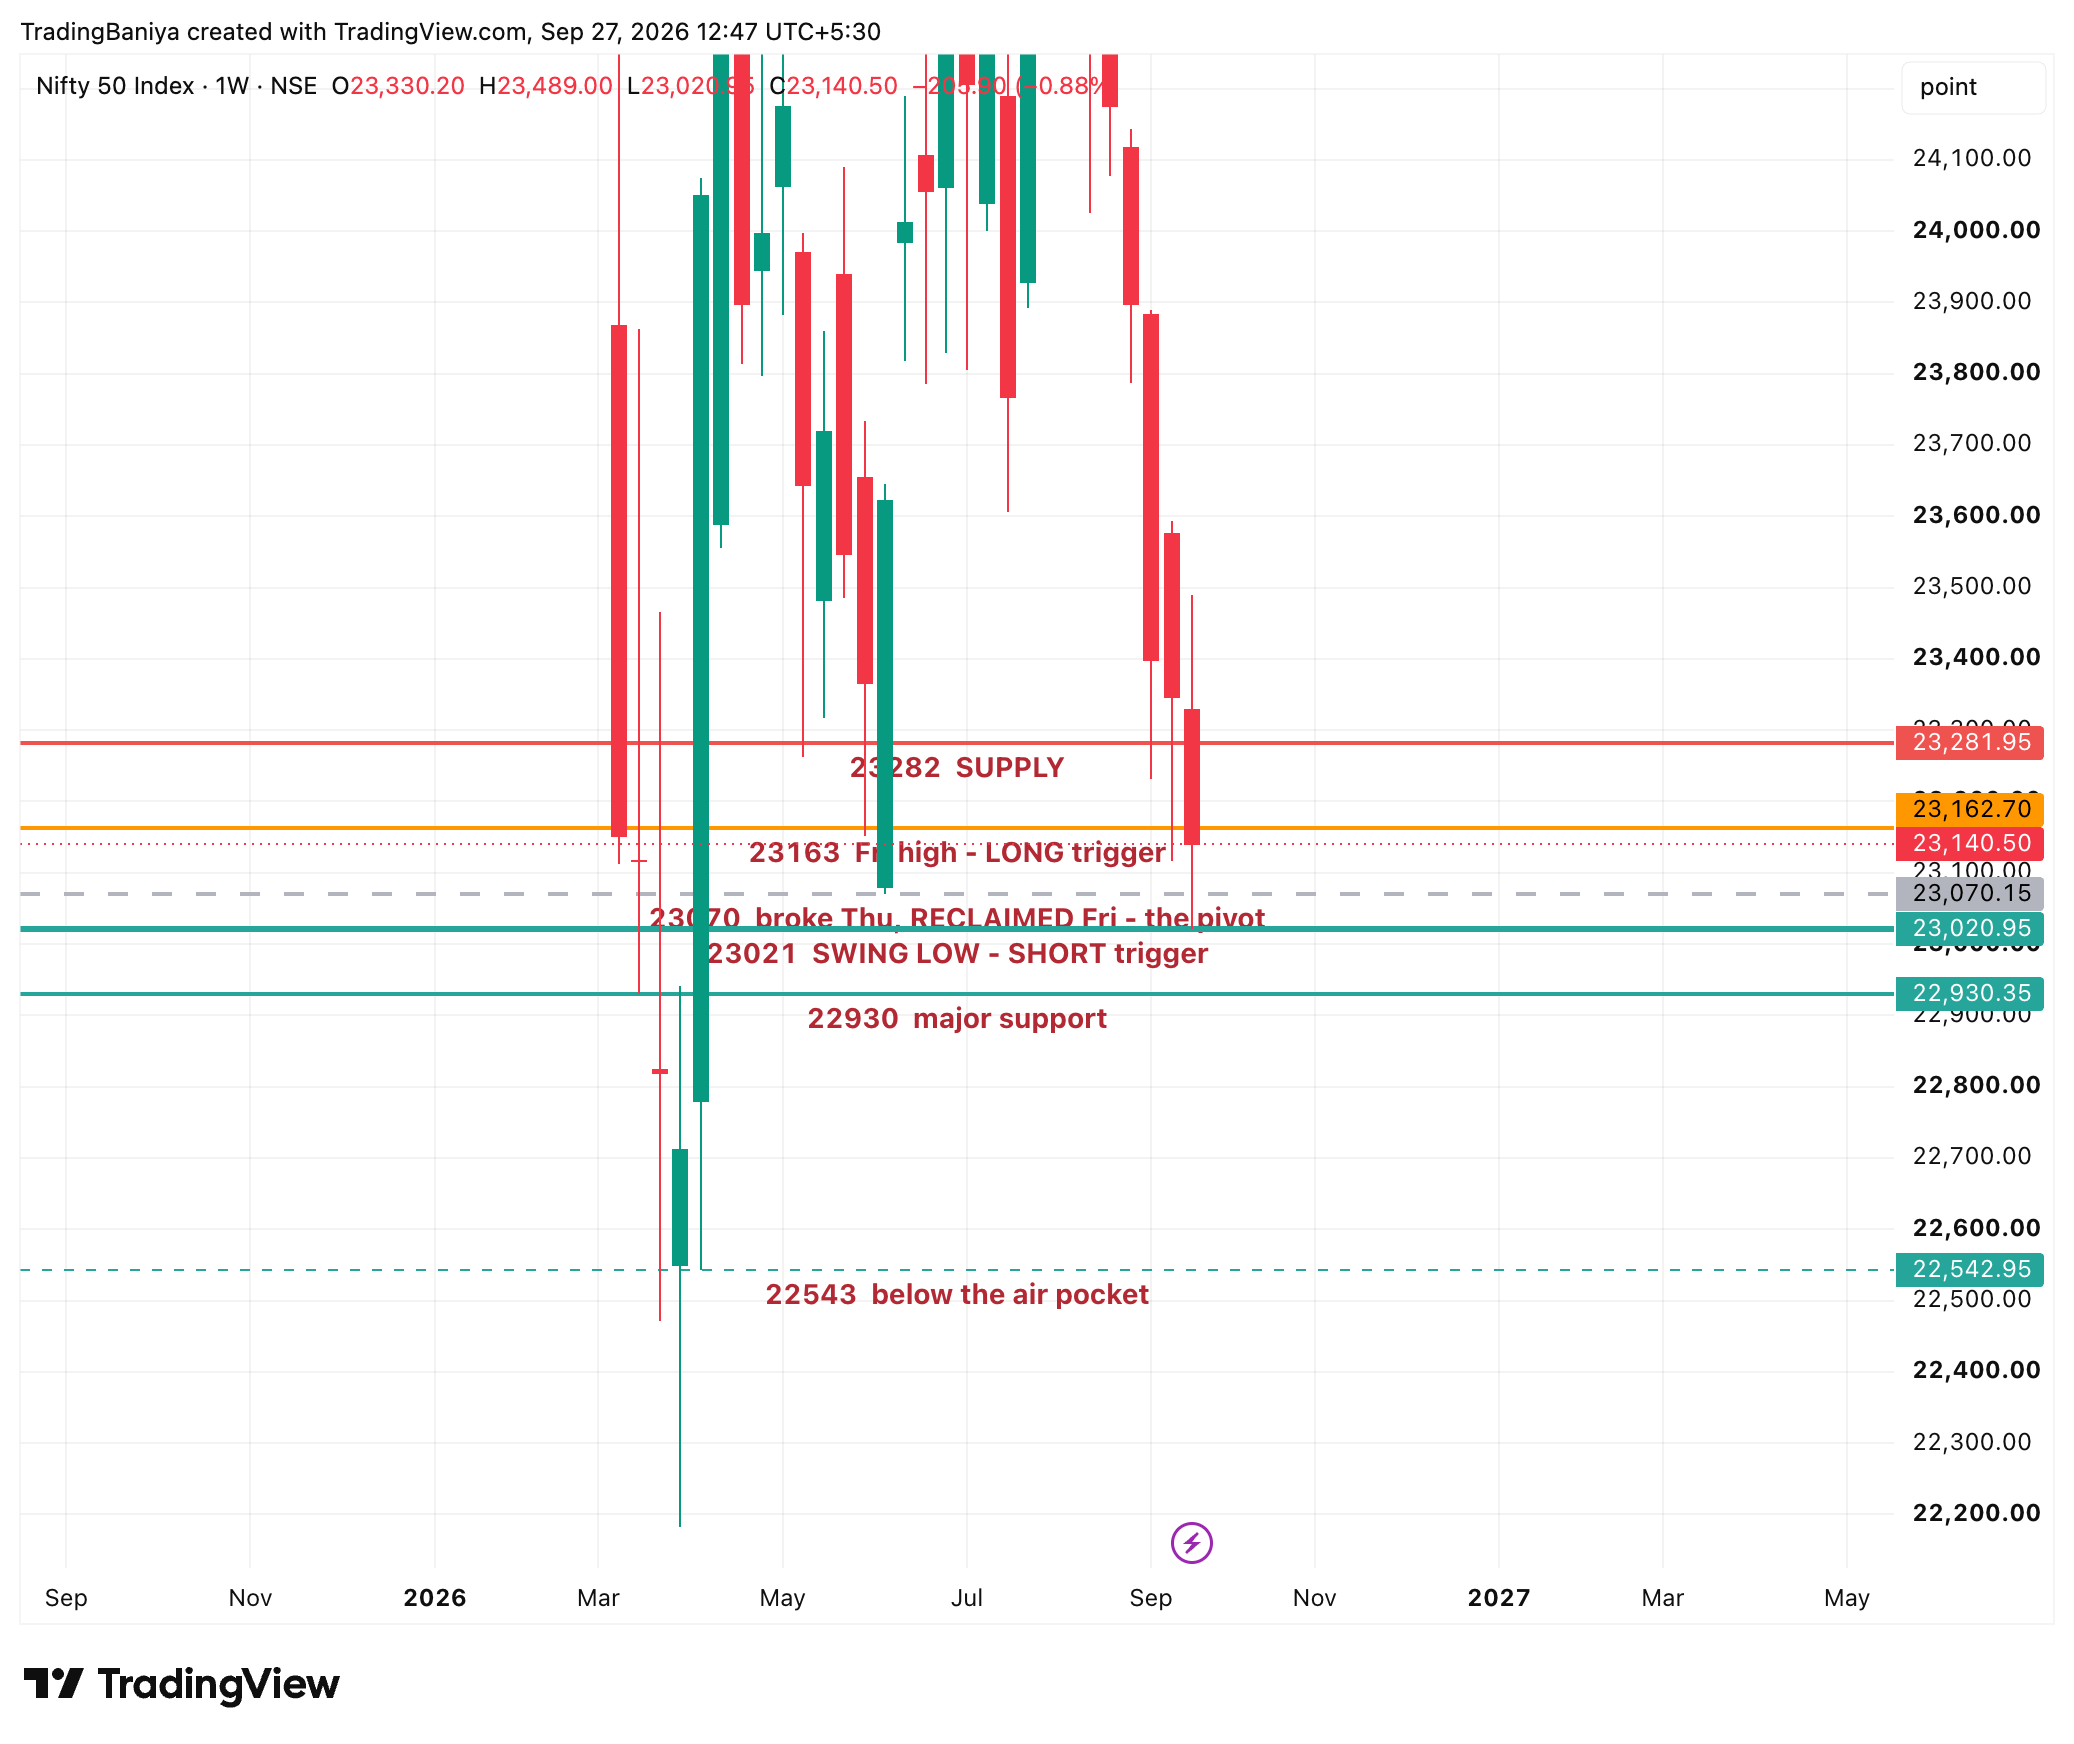
Namaste traders! Let's zoom out and look at the big weekly chart first, because it tells a historic story. If you look at the weekly candles, Nifty has printed 9 straight weeks of red or flat-to-negative closes. We are down a massive 12.3% from the January peak. This is the longest continuous losing streak we have seen in two and a half years. The trend is clearly walking down the stairs, and sellers are holding the remote control.
But here is the interesting part about this fall: it is a slow grind, not a sudden crash. When we look at the volume bars, there is no massive spike of panic selling. The India VIX (fear gauge) actually cooled down to 12.16 on Friday. In simple English, this means big institutions are quietly and steadily reducing their holdings. They are not rushing for the exit all at once. Usually, market bottoms happen when everyone panics. Since there is no panic yet, this quiet selling might just continue.
Now, let's step into the daily chart to see how last week played out. Monday to Wednesday gave a false sense of hope. The market slowly drifted upwards, touching a high of 23,489 on Tuesday. But as our smart money data warned last weekend, this was just a trap. Big players were using that small rally to sell their shares at better prices. Once they were done, they pulled the rug.
That rug pull happened on Thursday, and you can see it clearly as a massive empty space on the daily chart. Nifty opened with a 225-point 'gap down'. This means the market fell heavily before the trading bell even rang. When a gap like this happens, it shows that the decision to sell was made overnight, and regular retail buyers never even got a chance to fight or defend their positions. It was a brutal move.
This brings us to the action on Friday, which we need to look at on the 15-minute intraday chart. For the first half of the day, it was completely boring. The market just drifted lower and lower on very little volume, eventually making a new low for the week at 23,020.95 just before 1:00 PM. It looked like the market was going to bleed out completely.
But then, magic happened at exactly 2:00 PM. Look at that sudden, tall green candle on the 15-minute chart. In just five minutes, aggressive buyers stepped in with high volume (nearly 7 million shares) and pushed the price up by 100 points. This was not retail traders buying a few shares; this was a deliberate, large order executed by someone big who decided 23,020 was too cheap to ignore.
Because of that 2:00 PM buying, Friday ended up doing something called a 'failed breakdown'. The market fell below two very important support levels (23,070 and 23,116), looked around the basement, and then quickly climbed back upstairs to close at 23,140. When a market breaks a floor but refuses to stay down, it traps the late sellers. This is the best piece of news the bulls have had all month.
However, we must look at the reality of the live market data to keep our feet on the ground. FIIs (Foreign Institutional Investors) were still heavy net sellers on Friday, dumping over ₹5,027 crore in the cash market. Also, our Cumulative Volume Delta (CVD) check shows that overall selling pressure actually increased by 83 million last week as the price fell. The smart money is still flowing out.
Globally, the picture isn't helping us either. US 10-year Treasury bond yields have crossed 5.2%. When safe government bonds give such high returns, big global investors pull their money out of risky stock markets like India. Add to that Brent crude oil bouncing around $106 due to Middle East tensions, and we have heavy anchors pulling the market down.
So, what does this mean for a regular trader on Monday? Right now, Nifty is trapped in a very tight box of just 142 points. The ceiling is Friday's high of 23,162, and the floor is Friday's low of 23,020. If we break above the ceiling, we might see a quick bounce towards 23,281. But if we break below the floor, the downtrend resumes with full force.
The most dangerous level on the chart right now is 22,930. If you look at the charts, just below 22,930, there is what we call an 'air pocket'—a huge empty zone of almost 400 points where there is no historical support to stop a fall. If 22,930 breaks, the market could slide down to 22,543 very fast. Stay light, don't fight the overall downtrend, and wait for the market to choose its direction out of Friday's box.
- Nifty has fallen for 9 consecutive weeks, the longest losing streak in 2.5 years.
- The fall is slow and grinding with no panic volume, meaning big players are quietly exiting.
- A massive 225-point overnight gap down on Thursday showed sellers are in complete control.
- Friday saw strong, deliberate buying at 2:00 PM, saving the market from a deeper crash.
- FIIs are still selling heavily (₹5,027 cr on Friday) and global bond yields are dangerously high.
- We are stuck in a tight box: 23,021 (Floor) to 23,163 (Ceiling).
- Watch 22,930 carefully—if it breaks, a fast 400-point fall could happen.
Prepared by Nitish Goyal, SEBI Registered Research Analyst (INH000025993), under EquityMuni / Trading Baniya. For educational purposes only and not investment advice. Investment in securities market are subject to market risks; read all related documents carefully.