
Nifty Hits the Ceiling: Bull Trap or Just a Breather?
Nifty closed the week exactly where it started, forming a classic 'Doji' pattern at a major resistance zone. With volume dropping, the market is currently stuck in a 250-point range.
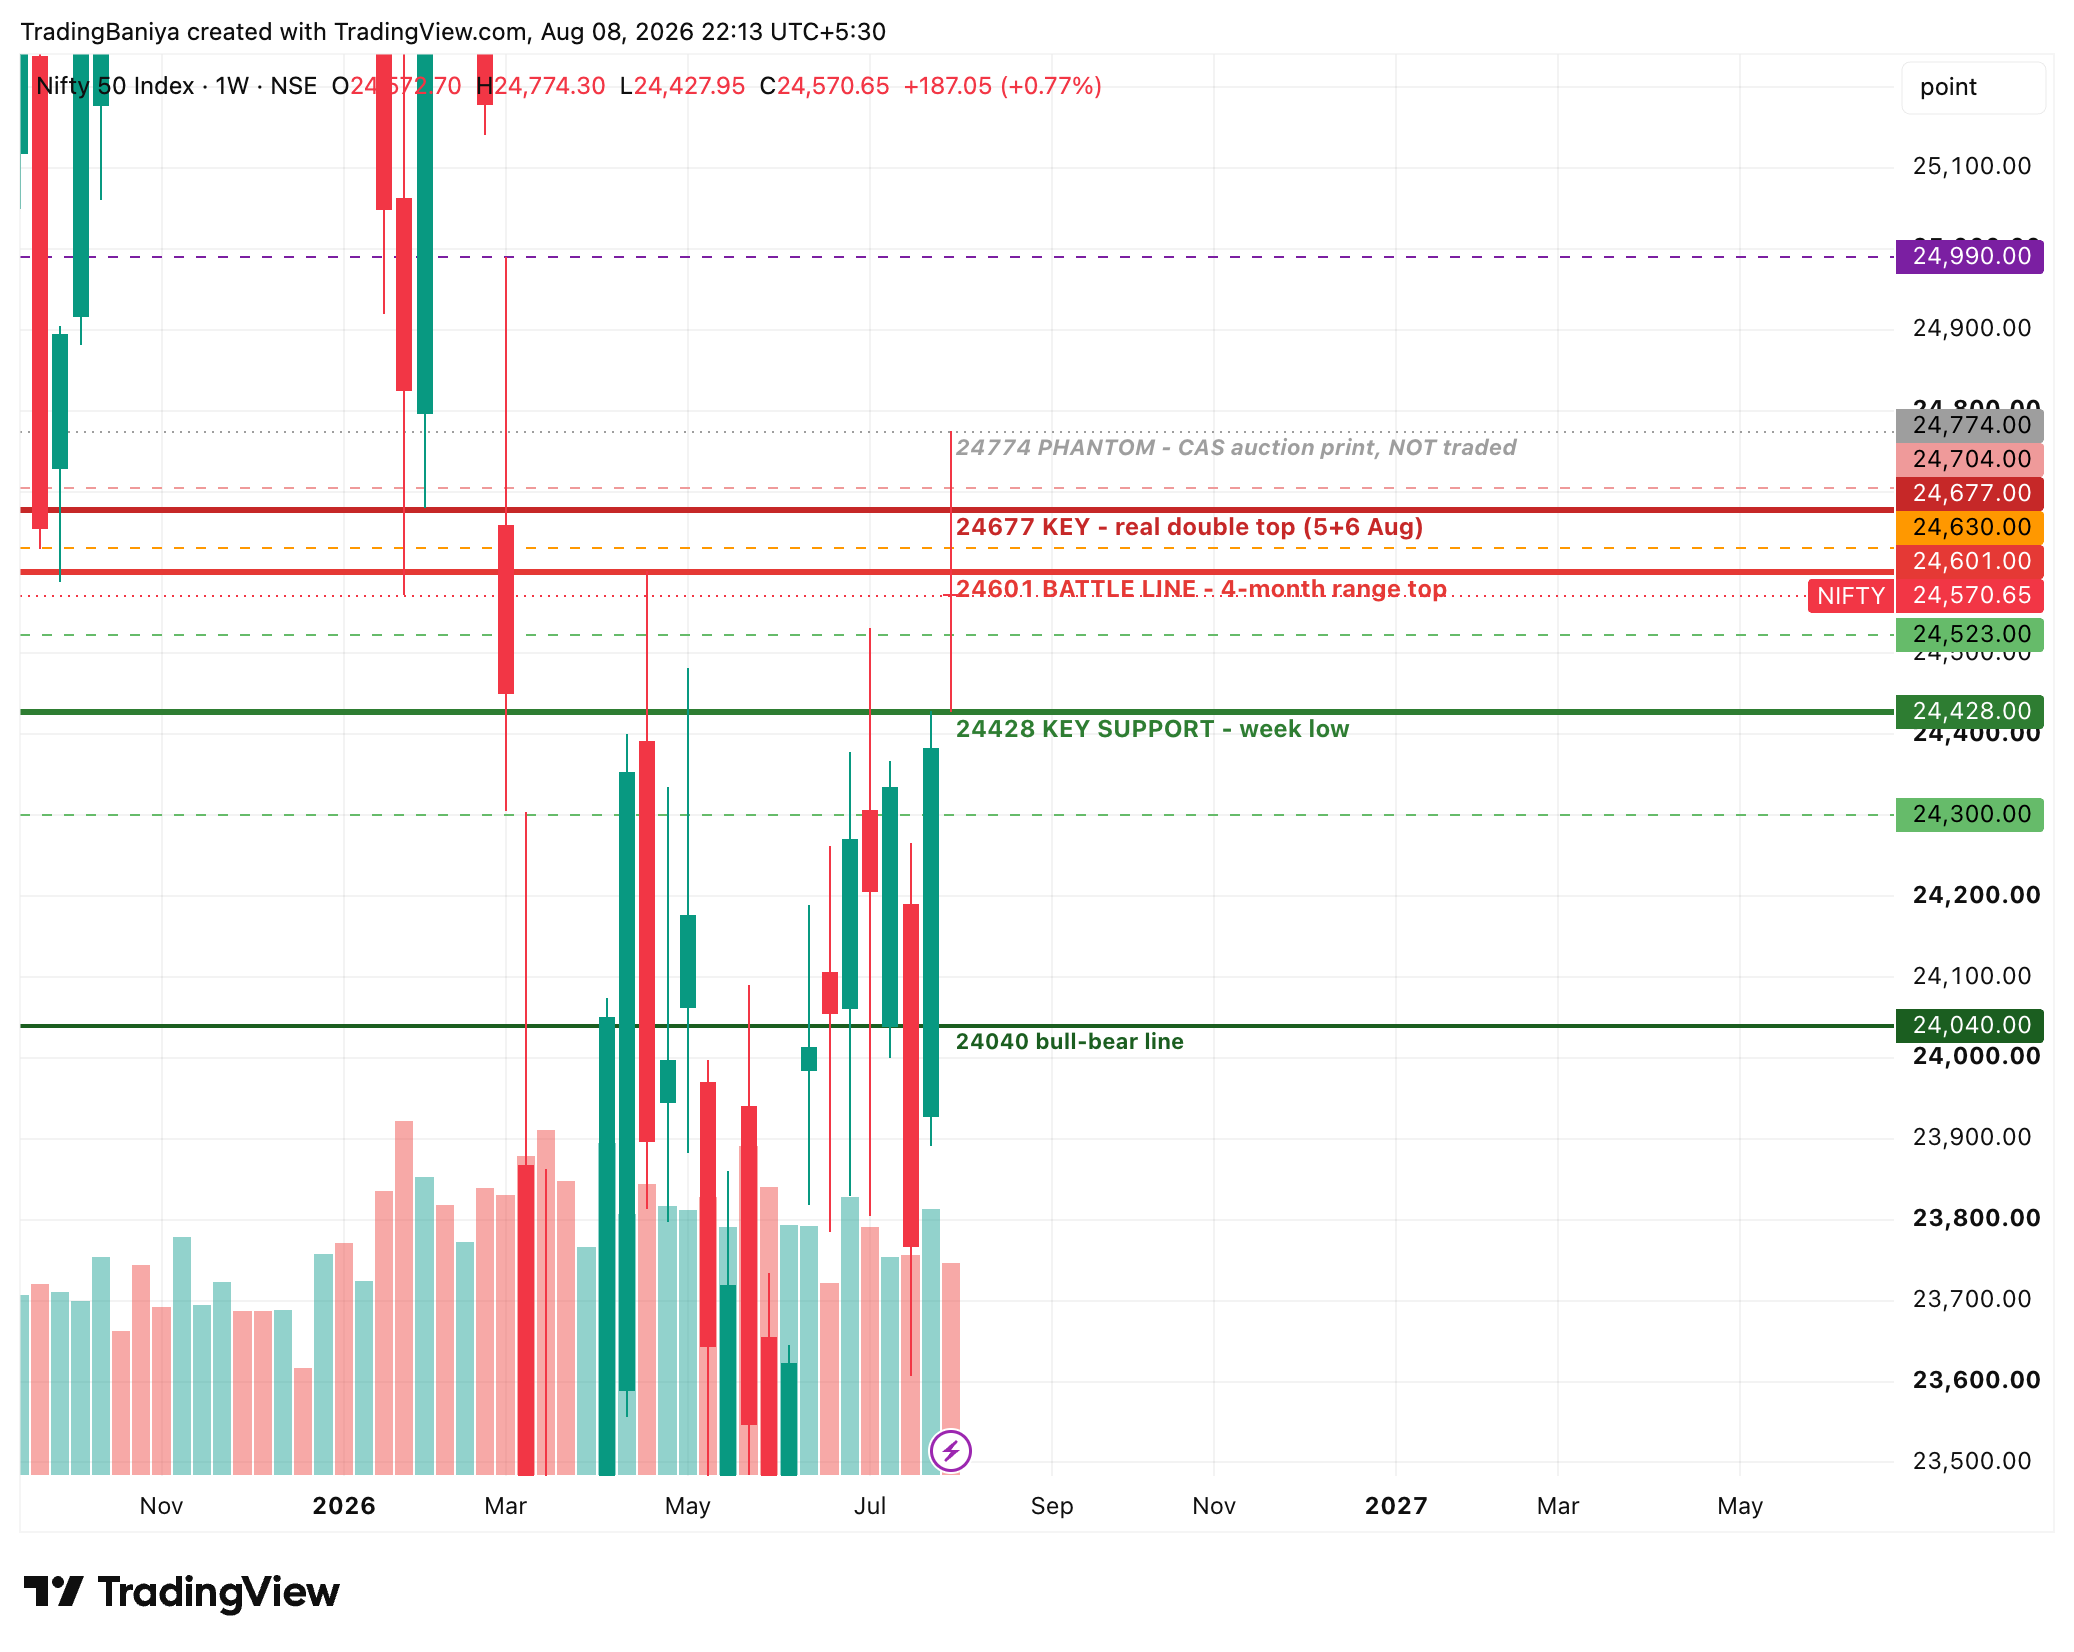
Namaste traders! Let us look at what the market is trying to tell us after a very interesting week. If you look at the Nifty Weekly chart (the first picture), last week opened at 24,572.70 and closed at 24,570.65. That is a grand total of a 2-point change over five whole days! In technical terms, this paints a classic 'Doji' candle on the weekly chart. A Doji is simply a candle with almost no body, meaning the opening and closing prices are nearly identical. Coming right after a massive 2.6% upward push the week before, this completely flat candle tells us one simple thing: the buyers have temporarily run out of fuel right at the ceiling.
Looking closer at that same weekly chart, you can clearly see the red dotted line marked '24601 BATTLE LINE'. This is the top of a four-month trading range. Despite all the wild swings, Nifty failed to close above this line on a weekly basis. To make matters a bit more cautious, trading volume fell by 20% compared to the previous week (1.59 billion versus 1.99 billion). When prices are near all-time highs but fewer people are participating, it shows that the big players are hesitant to buy at these expensive levels.
Now, let us zoom in on the Daily chart (the second picture). Tuesday is the day that reveals the real story. The market opened strong right at 24,703.90, making retail traders think a huge breakout was happening. But it was a 'bull trap'. Big players used that high price to dump their shares, sending the index crashing down 276 points to hit a low of 24,428. Anyone who blindly bought the Monday breakout news was instantly sitting in heavy losses.
The Daily chart also shows a clear pattern of exhaustion. Look at the highs Nifty made each day after that Tuesday dump: 24,704, then 24,678, then 24,677, and finally 24,630 on Friday. Do you see how the peaks are stepping down like a staircase? The buyers are getting weaker and weaker each day. Furthermore, Friday recorded the thinnest trading volume of the entire week, confirming the lack of buying interest.
Let us break down Friday's action using the 15-minute chart (the third picture). Friday was a textbook weak day for the market. It opened near 24,541, gave a quick morning spike to 24,630 within the first 20 minutes, and then slowly bled out for the rest of the day. It was a slow, painful, grinding sell-off down to 24,522.75 by the afternoon. The strategy was clear: big money was selling into the morning bounce.
By studying these three charts, we can clearly map out where the big money lives. The heavy selling zone is the red band between 24,677 and 24,704. Price was rejected here on Tuesday, Wednesday, and Thursday. This is our real ceiling. On the flip side, the buying zone is the green line at 24,428. When price crashed to this level on Tuesday, smart money bought it aggressively, pushing it back up. This gives us our true battlefield for the coming week: a 250-point box between 24,428 (Support) and 24,677 (Resistance).
We must also clear up a popular confusion. Many news channels celebrated Nifty touching 24,774 earlier in the week. However, as our charts show, that was a 'phantom' print from a thin pre-open auction. Real, heavy trading never actually took place there. The real double-top resistance where sellers are actively sitting is clearly at 24,677.
Looking at the live market context, the fundamentals support this stalled chart pattern. The RBI released a draft proposal signaling tighter rules for revolving credit, which heavily dragged down financial stocks like Bajaj Finance and Bank Nifty. While SBI reported great quarterly profits that saved the market from a deeper crash, the overall banking sector remained weak. We also see Brent crude oil rising past $83 per barrel due to Middle East tensions, which creates inflation fears for India. Interestingly, both FIIs (Rs 480 crore) and DIIs (Rs 235 crore) were mild net buyers in the cash market on Friday, suggesting they are picking specific stocks rather than buying the whole index.
To be perfectly fair to the bulls, this market is stalling, not crashing. The green support line at 24,428 held strong and was defended well. We are still trading comfortably above the major July base. The longer-term uptrend is still very much intact. However, the short-term momentum has hit a solid brick wall.
So, what is the game plan for a regular trader? We are in a range-bound market. Rallies toward 24,630-24,677 should be viewed as selling opportunities, not places to buy fresh breakouts. We only become aggressively Bullish if Nifty gives a strong daily close above 24,677 with massive volume. On the downside, a close below Friday's low of 24,523 will be our Bearish trigger, opening the door down to the 24,428 floor. If 24,428 breaks, the entire recent breakout is officially a failure.
- Nifty formed a Weekly Doji, indicating a complete pause in momentum.
- Trading volume dropped 20% near the highs, showing a lack of buyer confidence.
- A massive 'Bull Trap' occurred on Tuesday, trapping breakout buyers.
- The real resistance ceiling is 24,677, where sellers are aggressively parked.
- Strong demand exists at 24,428, where buyers fiercely defended the dip.
- RBI news weighed down financials, preventing Nifty from pushing higher.
- Trading strategy: Sell the rallies near 24,677; watch 24,428 for strong support.
Prepared by Nitish Goyal, SEBI Registered Research Analyst (INH000025993), under EquityMuni / Trading Baniya. For educational purposes only and not investment advice. Investment in securities market are subject to market risks; read all related documents carefully.