
A Perfect Bounce or a Trap? Unpacking Nifty's Double Bottom
Nifty tested its crucial April low, bounced back perfectly by just 2.65 points, and broke a long losing streak. But hidden data shows we must tread carefully. Let's decode the charts.
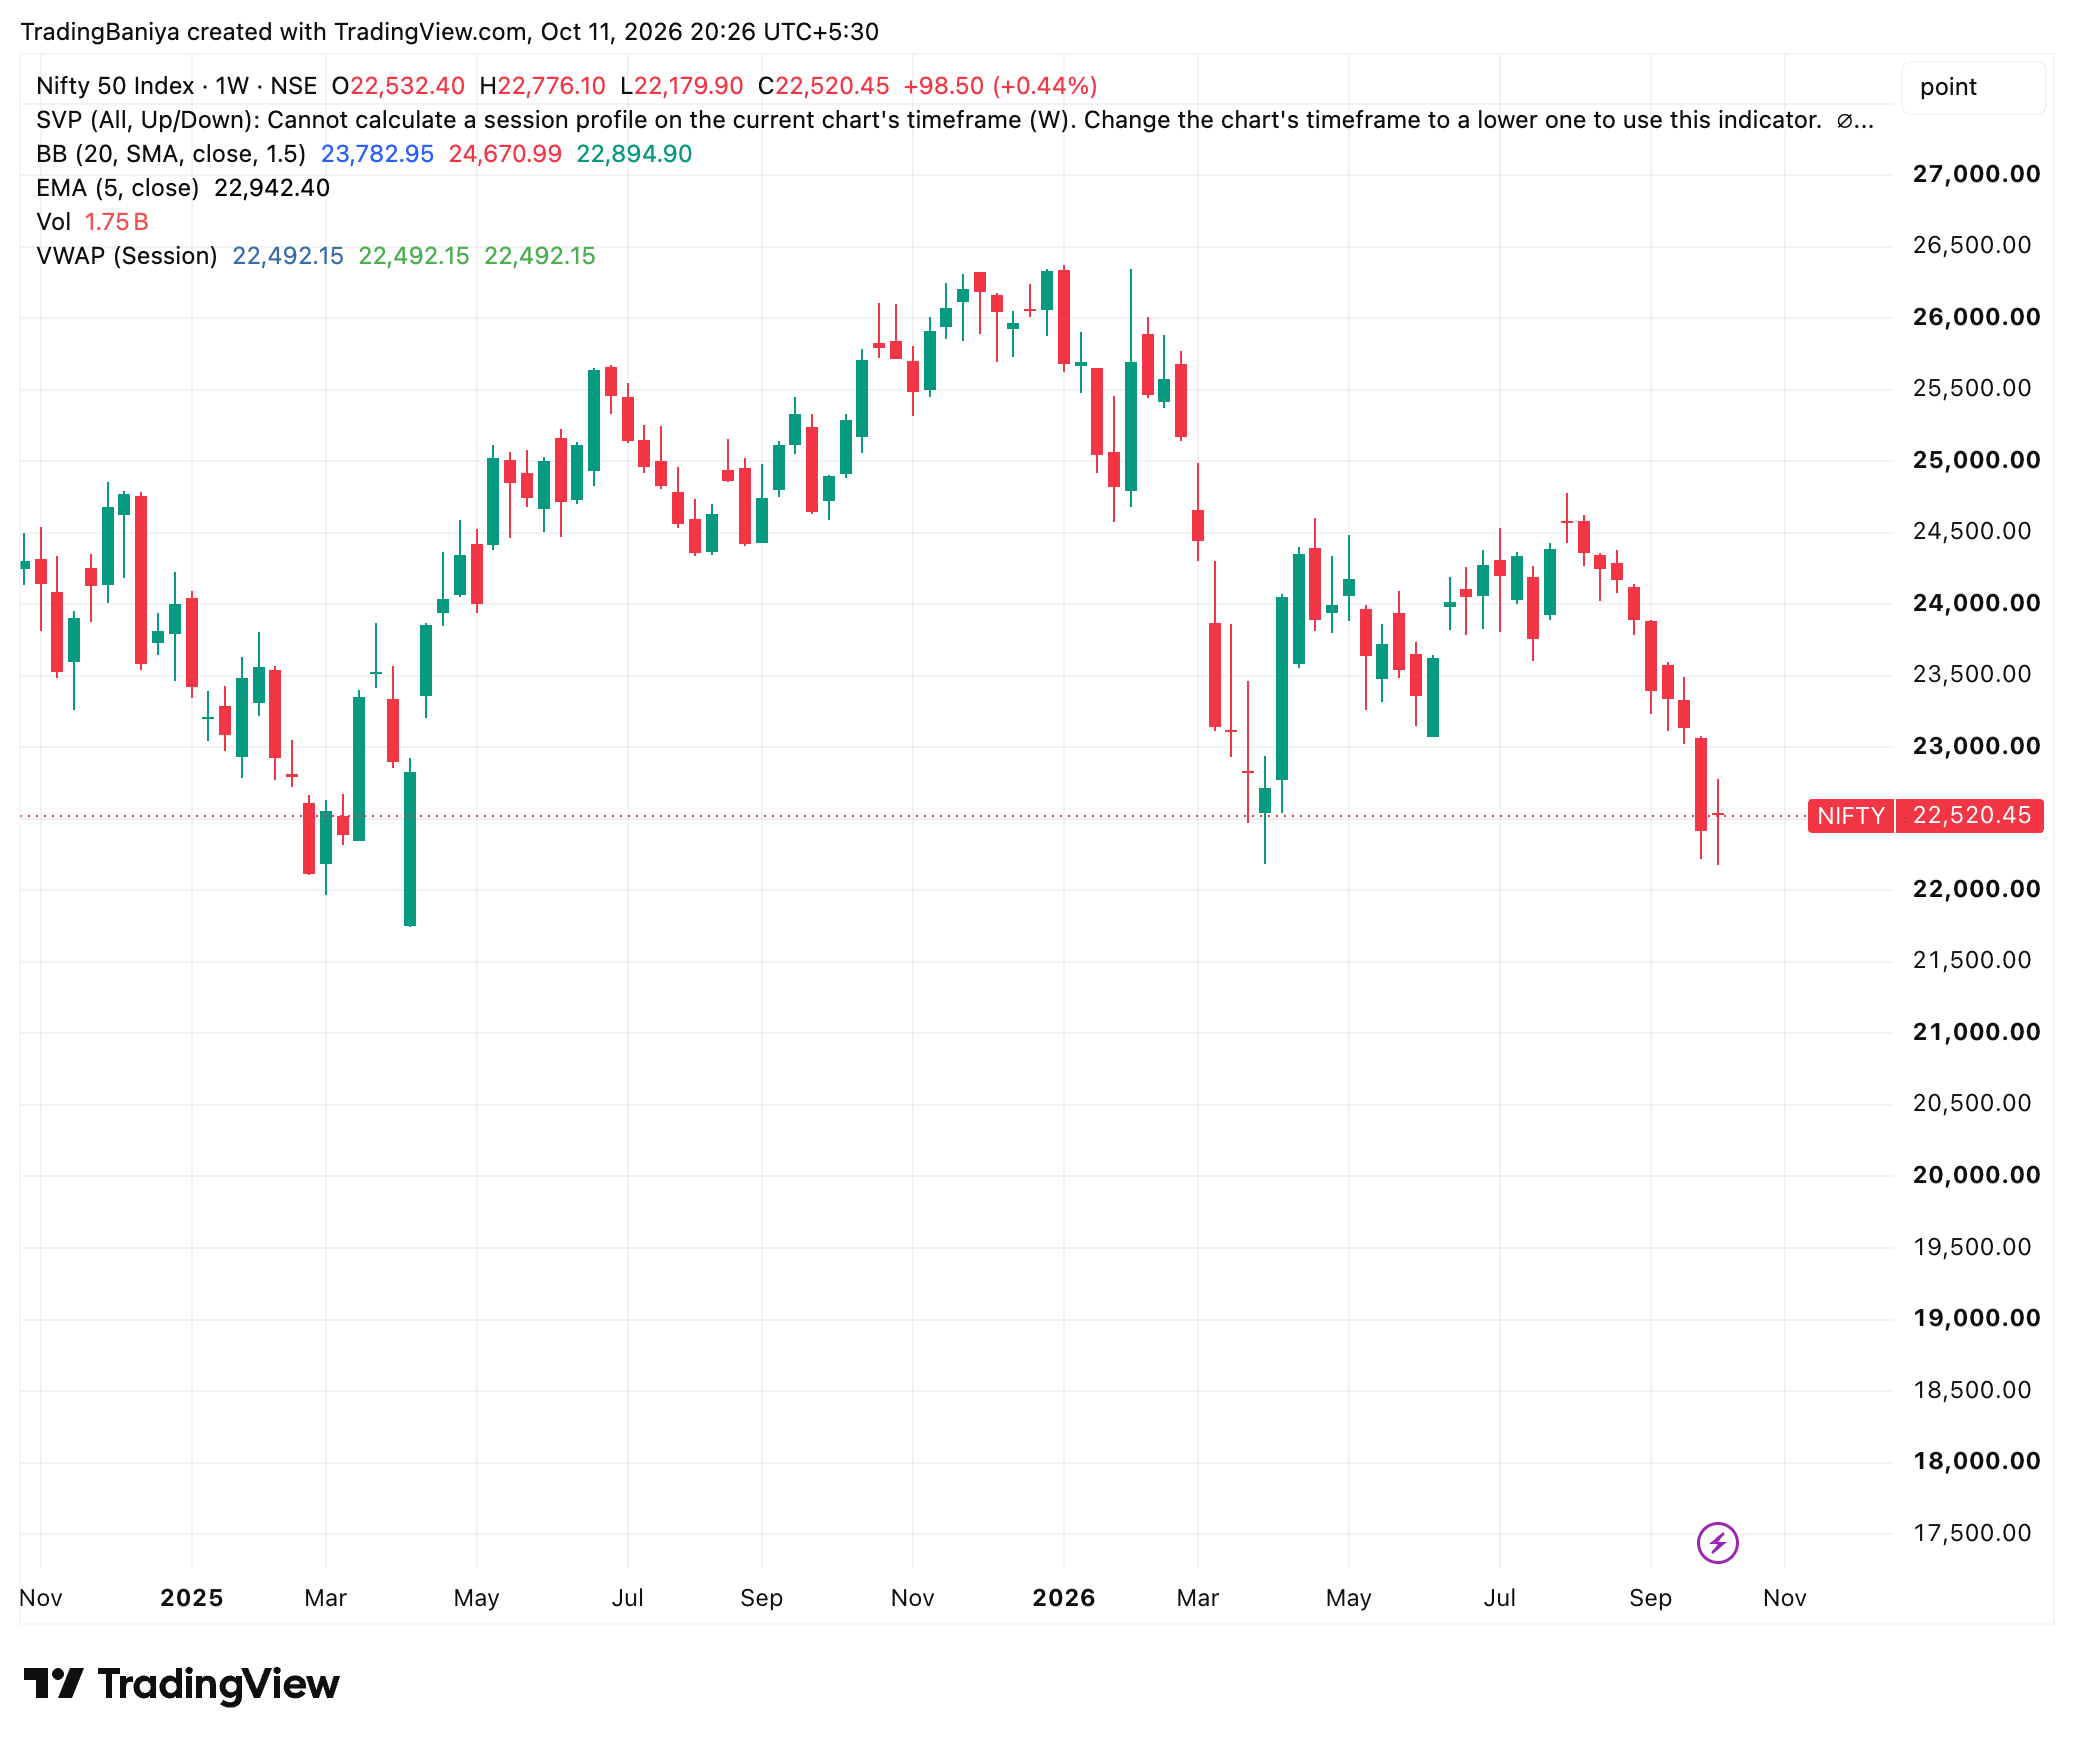
Namaste traders! Let's look at the weekly chart first. For weeks, we've seen a painful sea of red candles. Technically, this week's candle is still red because the closing price was slightly below Monday's opening price. However, here is the real good news: if you compare last Friday's close to this Friday's close, the market actually ended in the green (+98.50 points). This officially breaks the long streak of lower weekly closes we've suffered since July.
Now, look closely at the shape of that latest weekly candle on the first chart. Notice that long 'tail' or wick at the bottom? In trading language, we call this a 'hammer'. It paints a clear picture: sellers tried to push the market way down, but buyers stepped in forcefully to pull it right back up. This is the first truly positive weekly shape we have seen in this entire downward journey.
The most important action of the week happened on Thursday. If you look at the charts, the market dropped to 22,179.90. Why is this specific number magical? Because the major low we made back in April was 22,182.55. The market broke that old April low by just 2.65 points—a tiny fraction—and immediately rejected the fall, bouncing back up.
This creates what we call a 'Double Bottom' pattern, spaced exactly six months apart. To have a retest this precise (just 2.65 points apart) is incredibly rare. This is the third time in four weeks that the market tried to break a major low and failed. It shows us that a very strong, concrete floor is being built around the 22,180 zone.
Moving over to the daily chart, Friday gave us a strong green candle, adding over 218 points. It was the first day this week where the market made a 'higher low' compared to the previous day. However, look at where it stopped. Friday closed at 22,520.45, which is sitting exactly on the daily moving average line (EMA). When price parks exactly on this line, it means the market is taking a breath and has no strong directional opinion just yet.
Also on the daily chart, notice the faint lines curving around the price—these are the Bollinger Bands. Earlier in the week, the price had fallen outside the lower band, like a rubber band stretched way too far. Now, it has snapped back comfortably inside. The 'oversold' fuel that powered this Friday bounce is now used up. The next move upwards will require genuine buying power, not just a bounce from being stretched.
Let's talk about the fuel behind the move: volume. We have seen two back-to-back weeks of record trading volume, over 1.7 billion shares. When you see massive volume at a major low point, and the price flat-out refuses to break down, it is usually a textbook sign of 'accumulation'. This means big players are quietly buying up shares at these lower prices.
But, I promised to be completely honest with you, and the internal data is throwing some mixed signals. On the positive side, the intense weekly selling pressure we saw last week dropped massively. However, on Friday, despite the market jumping 218 points, the internal data (CVD) showed some heavy selling happening behind the scenes. It's like a car rolling uphill while someone is secretly gently pressing the brakes.
We saw this play out in Friday's intraday action. The morning started with a bang—strong, decisive buying pushed the market up over 160 points in the first hour. But the last hour of the day was a very different story. It took massive effort and volume, yet the market actually went backward by 9 points. The buyers simply ran out of energy at the top near 22,580.
Helping to lift the mood on Friday were strong Q2 earnings from TCS, which pushed the IT sector up nicely. It's also worth noting that Foreign Institutional Investors (FIIs) are still selling heavily (over Rs 3,500 crore on Friday), but our Domestic Institutional Investors (DIIs) are happily buying it all up (injecting over Rs 4,700 crore), acting as a strong shield for the market. Easing crude oil prices also helped calm inflation fears.
So, what does this mean for you, the everyday retail trader? Next week is slightly more likely to go up than down—I'd say a 55/45 chance. The double bottom at 22,180 is the most structurally bullish setup we've seen in months. However, remember that the long-term trend is still downward. We are still trading below key weekly averages, and that late-Friday buyer exhaustion is a clear warning sign not to become blindly aggressive.
Here is the simple game plan. For a safe upward entry, we need to see the market firmly cross Tuesday's high of 22,776 on a 5-minute closing basis; if it does, the doors open towards 22,930. On the downside, if the market tries to test that April floor of 22,180 again and breaks below it, the floor falls out, and we could see a quick, sharp slide toward 21,743. Be patient, and let the market trigger these levels first!
- The long streak of lower weekly closes has finally been broken.
- Nifty formed a precise 'Double Bottom' by testing the April low (missed by just 2.65 points) and bouncing strongly.
- The weekly chart shows a 'hammer' candle, indicating strong buying interest at lower levels.
- Friday closed exactly on the daily moving average, showing the market is taking a pause.
- Internal data warns of some hidden selling pressure, especially in Friday's last hour of trading.
- TCS earnings and heavy DII buying (over Rs 4,700 crore) provided strong market support.
- Wait for a clean break above 22,776 to confirm the upward move, or a break below 22,180 to signal danger.
Prepared by Nitish Goyal, SEBI Registered Research Analyst (INH000025993), under EquityMuni / Trading Baniya. For educational purposes only and not investment advice. Investment in securities market are subject to market risks; read all related documents carefully.